Note
Go to the end to download the full example code.
Shared Axes & Outer Labels
When a subplot grid shares an axis, drawing tick labels and axis labels
on every panel is redundant — the interior labels just repeat the
shared scale. publiplots handles this the way seaborn’s FacetGrid
does: pass sharex / sharey to pp.subplots() and the
interior labels are hidden automatically, leaving labels only on the
bottom row (x) and the left column (y).
This is the publiplots equivalent of matplotlib’s
label_outer(). Because publiplots builds its
grid with fig.add_axes (no SubplotSpec), the standard
ax.label_outer() is unavailable — the outer edge is computed from
publiplots’ own axes matrix instead, and exposed through two surfaces:
``pp.subplots(…, label_outer=True)`` — the default. Hiding is applied automatically when
sharex/shareyis active.``pp.label_outer(axes, *, sharex, sharey)`` — a standalone helper mirroring
ax.label_outer(). Use it to re-apply outer-only labeling after lateset_xlabel/set_ylabelcalls, or on a grid built elsewhere.
A welcome side effect: hidden interior labels free their reserved space, so the auto-layout engine tightens the canvas — the panels pack closer together without changing their declared millimetre sizes.
import publiplots as pp
import pandas as pd
import numpy as np

# Shared fixture --------------------------------------------------------------

rng = np.random.default_rng(42)
_df = pd.DataFrame({
    "x": rng.normal(size=320),
    "y": rng.normal(size=320),
    "group": np.tile(["Control", "Low", "High"], 320 // 3 + 1)[:320],
    "panel": np.repeat(["A", "B", "C", "D", "E", "F"], 320 // 6 + 1)[:320],
})
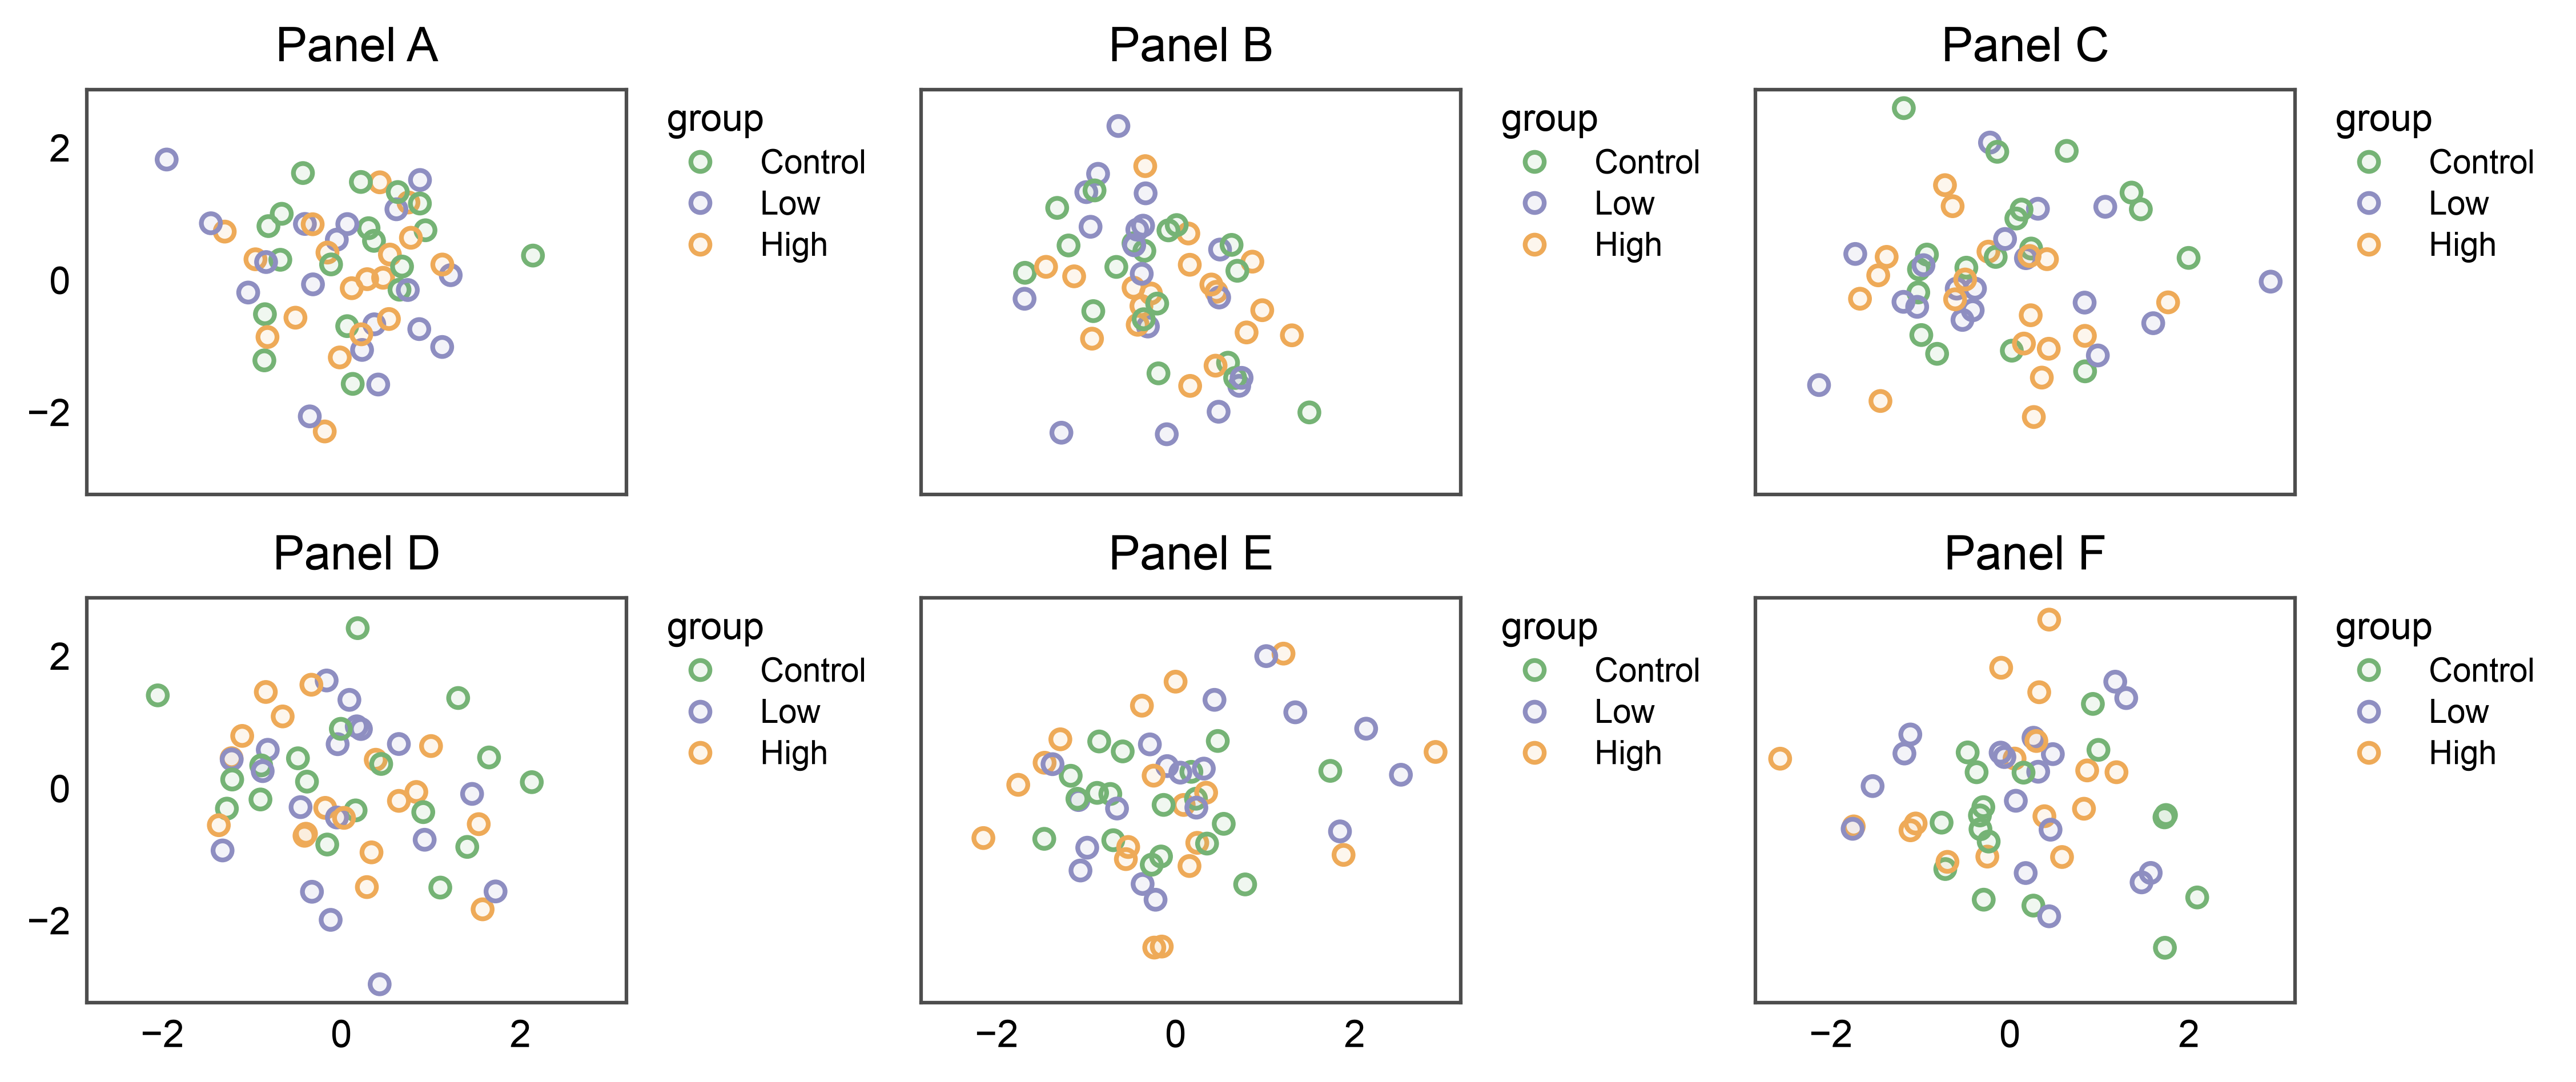
1. The default: shared axes hide interior labels
With sharex=True, sharey=True (and the default label_outer=True),
a 2x3 grid keeps x labels only on the bottom row and y labels only on
the left column. The interior panels are clean, and the grid tightens
to reclaim the space the hidden labels would have taken.
fig, axes = pp.subplots(2, 3, axes_size=(40, 30), sharex=True, sharey=True)
for (r, c), panel in zip(
    [(0, 0), (0, 1), (0, 2), (1, 0), (1, 1), (1, 2)], "ABCDEF"
):
    pp.scatterplot(
        data=_df[_df["panel"] == panel], x="x", y="y",
        hue="group", palette="pastel",
        title=f"Panel {panel}", ax=axes[r, c],
    )
pp.show()
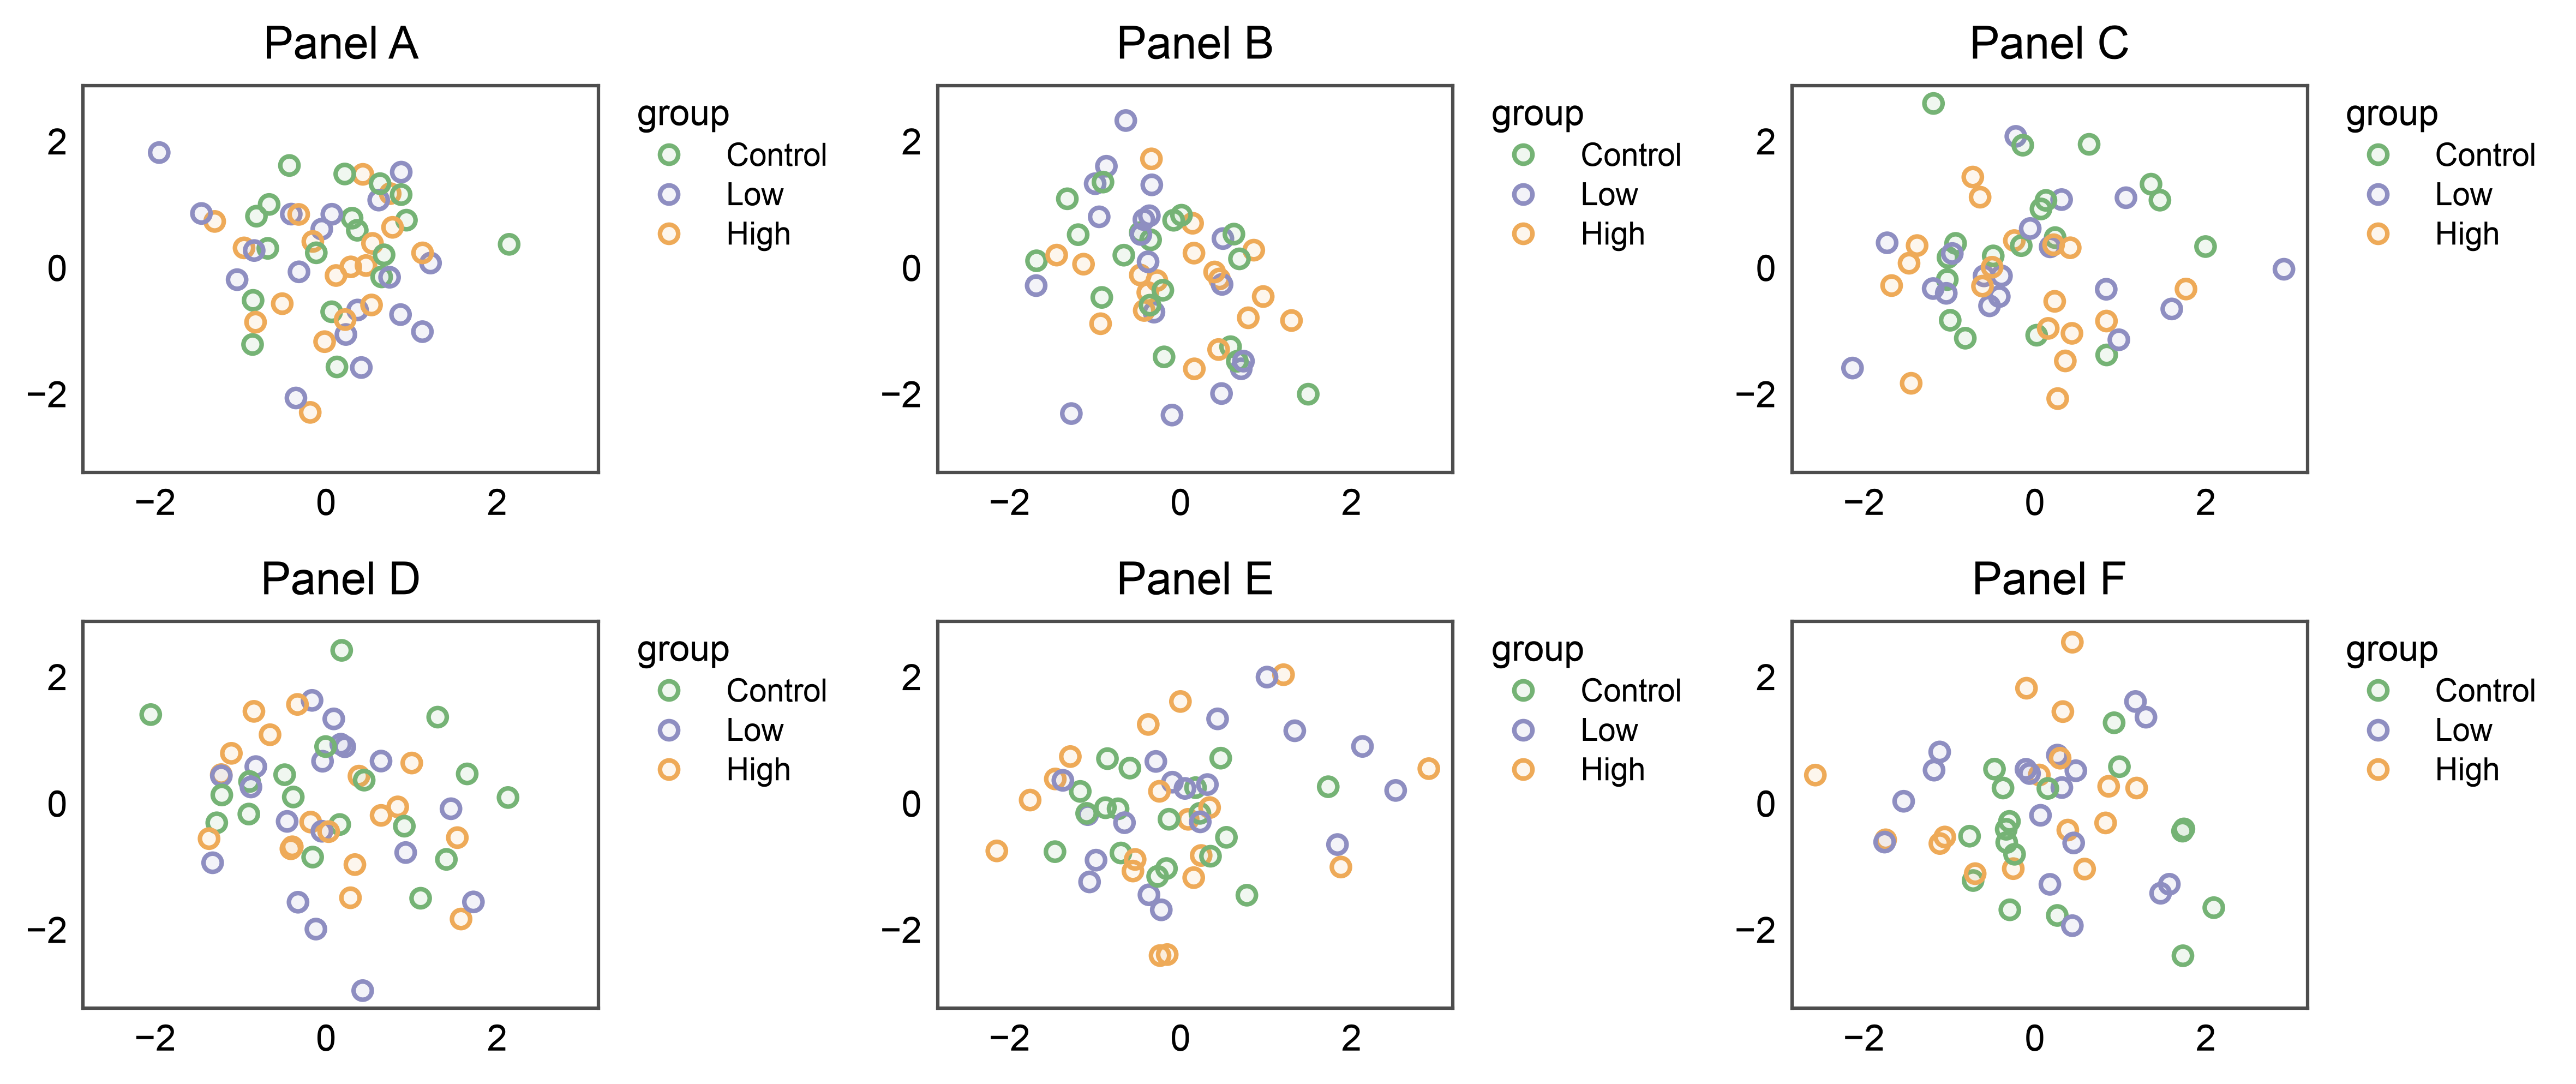
2. Opt out with label_outer="all"
Pass label_outer="all" (or False) to draw every label on every
panel — the pre-existing behaviour. Compare the duplicated x / y
labels and tick labels here against the clean grid above.
fig, axes = pp.subplots(
    2, 3, axes_size=(40, 30), sharex=True, sharey=True, label_outer="all",
)
for (r, c), panel in zip(
    [(0, 0), (0, 1), (0, 2), (1, 0), (1, 1), (1, 2)], "ABCDEF"
):
    pp.scatterplot(
        data=_df[_df["panel"] == panel], x="x", y="y",
        hue="group", palette="pastel",
        title=f"Panel {panel}", ax=axes[r, c],
    )
pp.show()
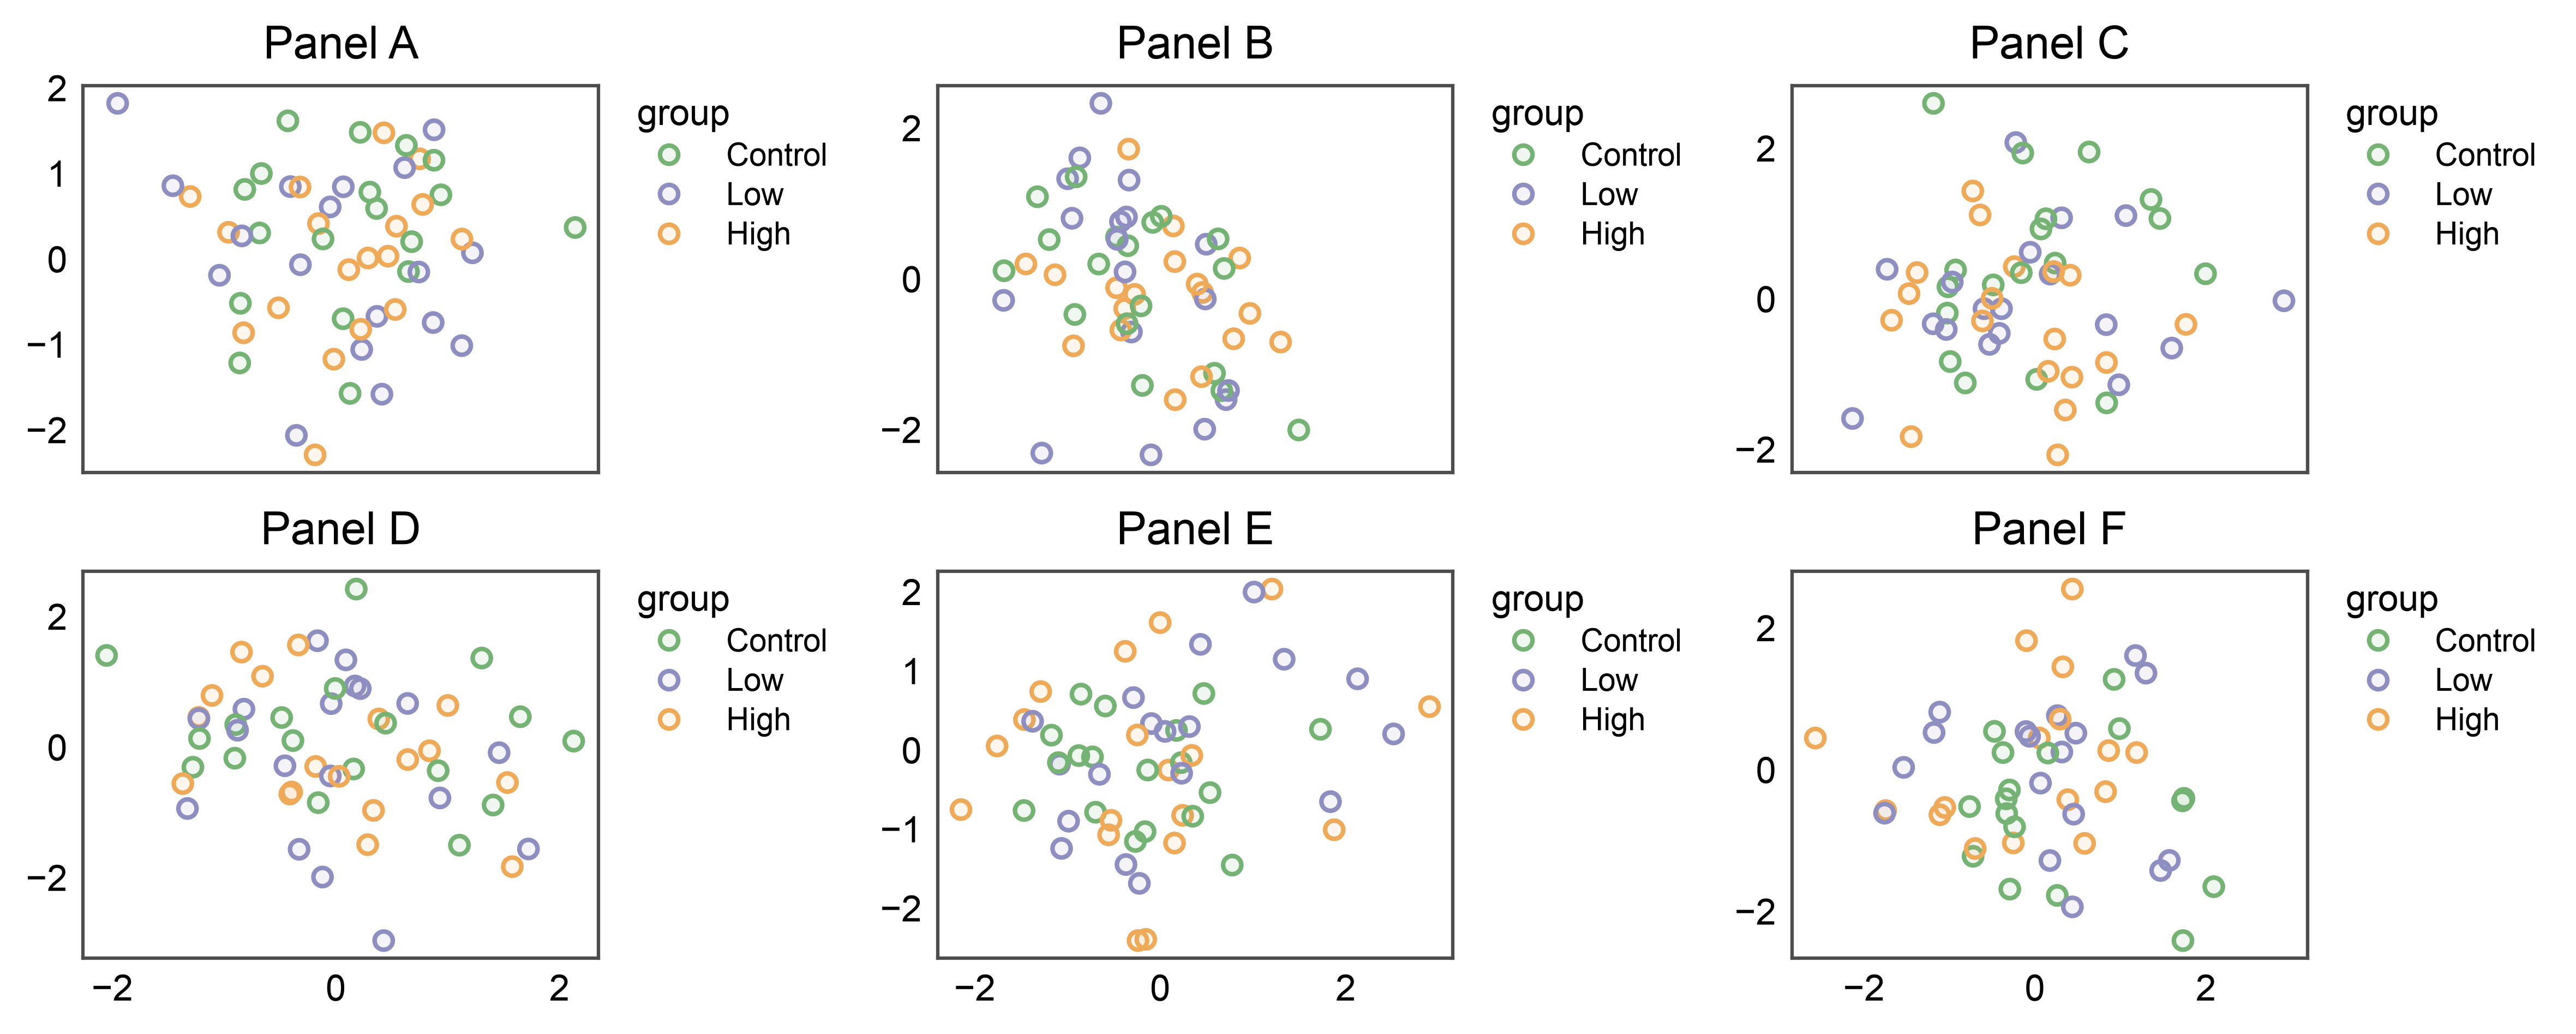
3. Share one axis only
sharex and sharey are independent. Sharing only the x-axis
(sharex="col") hides x labels on the non-bottom rows but leaves
every y label in place — each column still reads its own vertical
scale. Use sharey="row" for the mirror case.
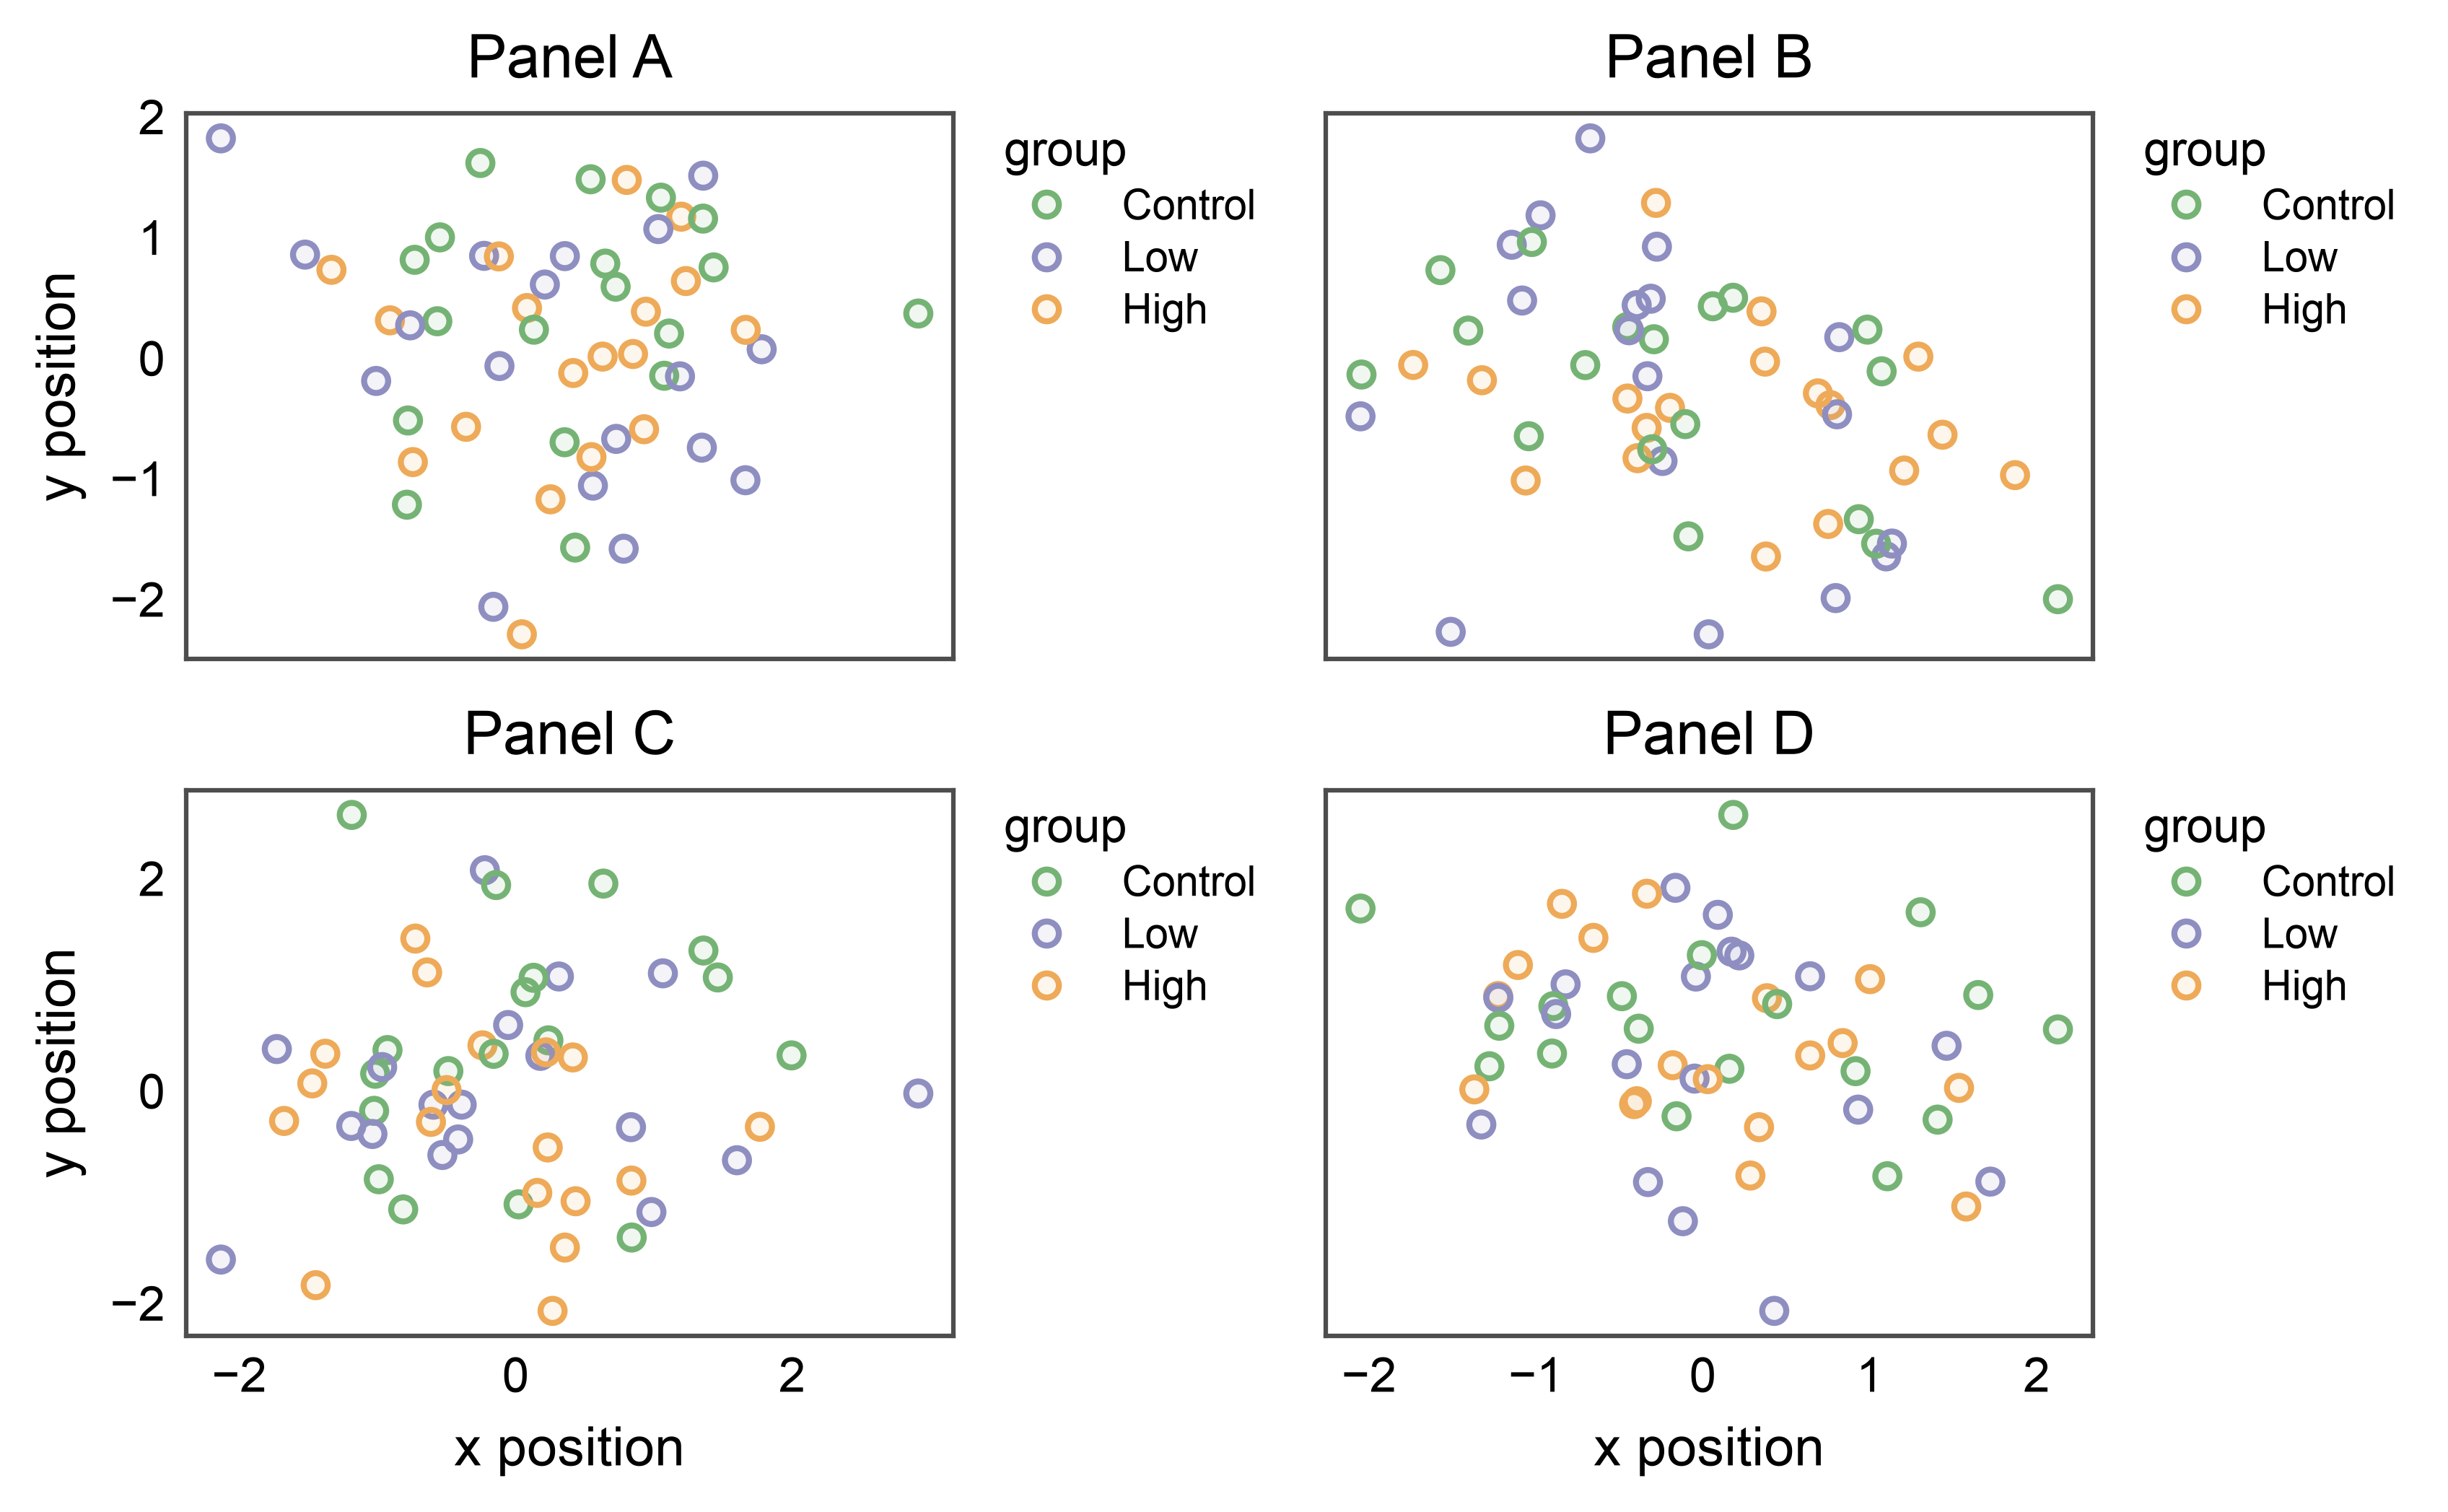
4. The standalone pp.label_outer helper
pp.subplots applies outer-only labeling at construction. If you set
axis labels after that — or build the grid without sharing and decide
later — call pp.label_outer(axes, sharex=..., sharey=...) to (re)apply
it. It operates in place, just like ax.label_outer().
fig, axes = pp.subplots(2, 2, axes_size=(45, 32), label_outer="all")
for (r, c), panel in zip([(0, 0), (0, 1), (1, 0), (1, 1)], "ABCD"):
    pp.scatterplot(
        data=_df[_df["panel"] == panel], x="x", y="y",
        hue="group", palette="pastel",
        title=f"Panel {panel}", ax=axes[r, c],
    )
    axes[r, c].set_xlabel("x position")
    axes[r, c].set_ylabel("y position")

# Hide interior labels post-hoc — keeps x on the bottom row, y on the left.
pp.label_outer(axes, sharex=True, sharey=True)
pp.show()
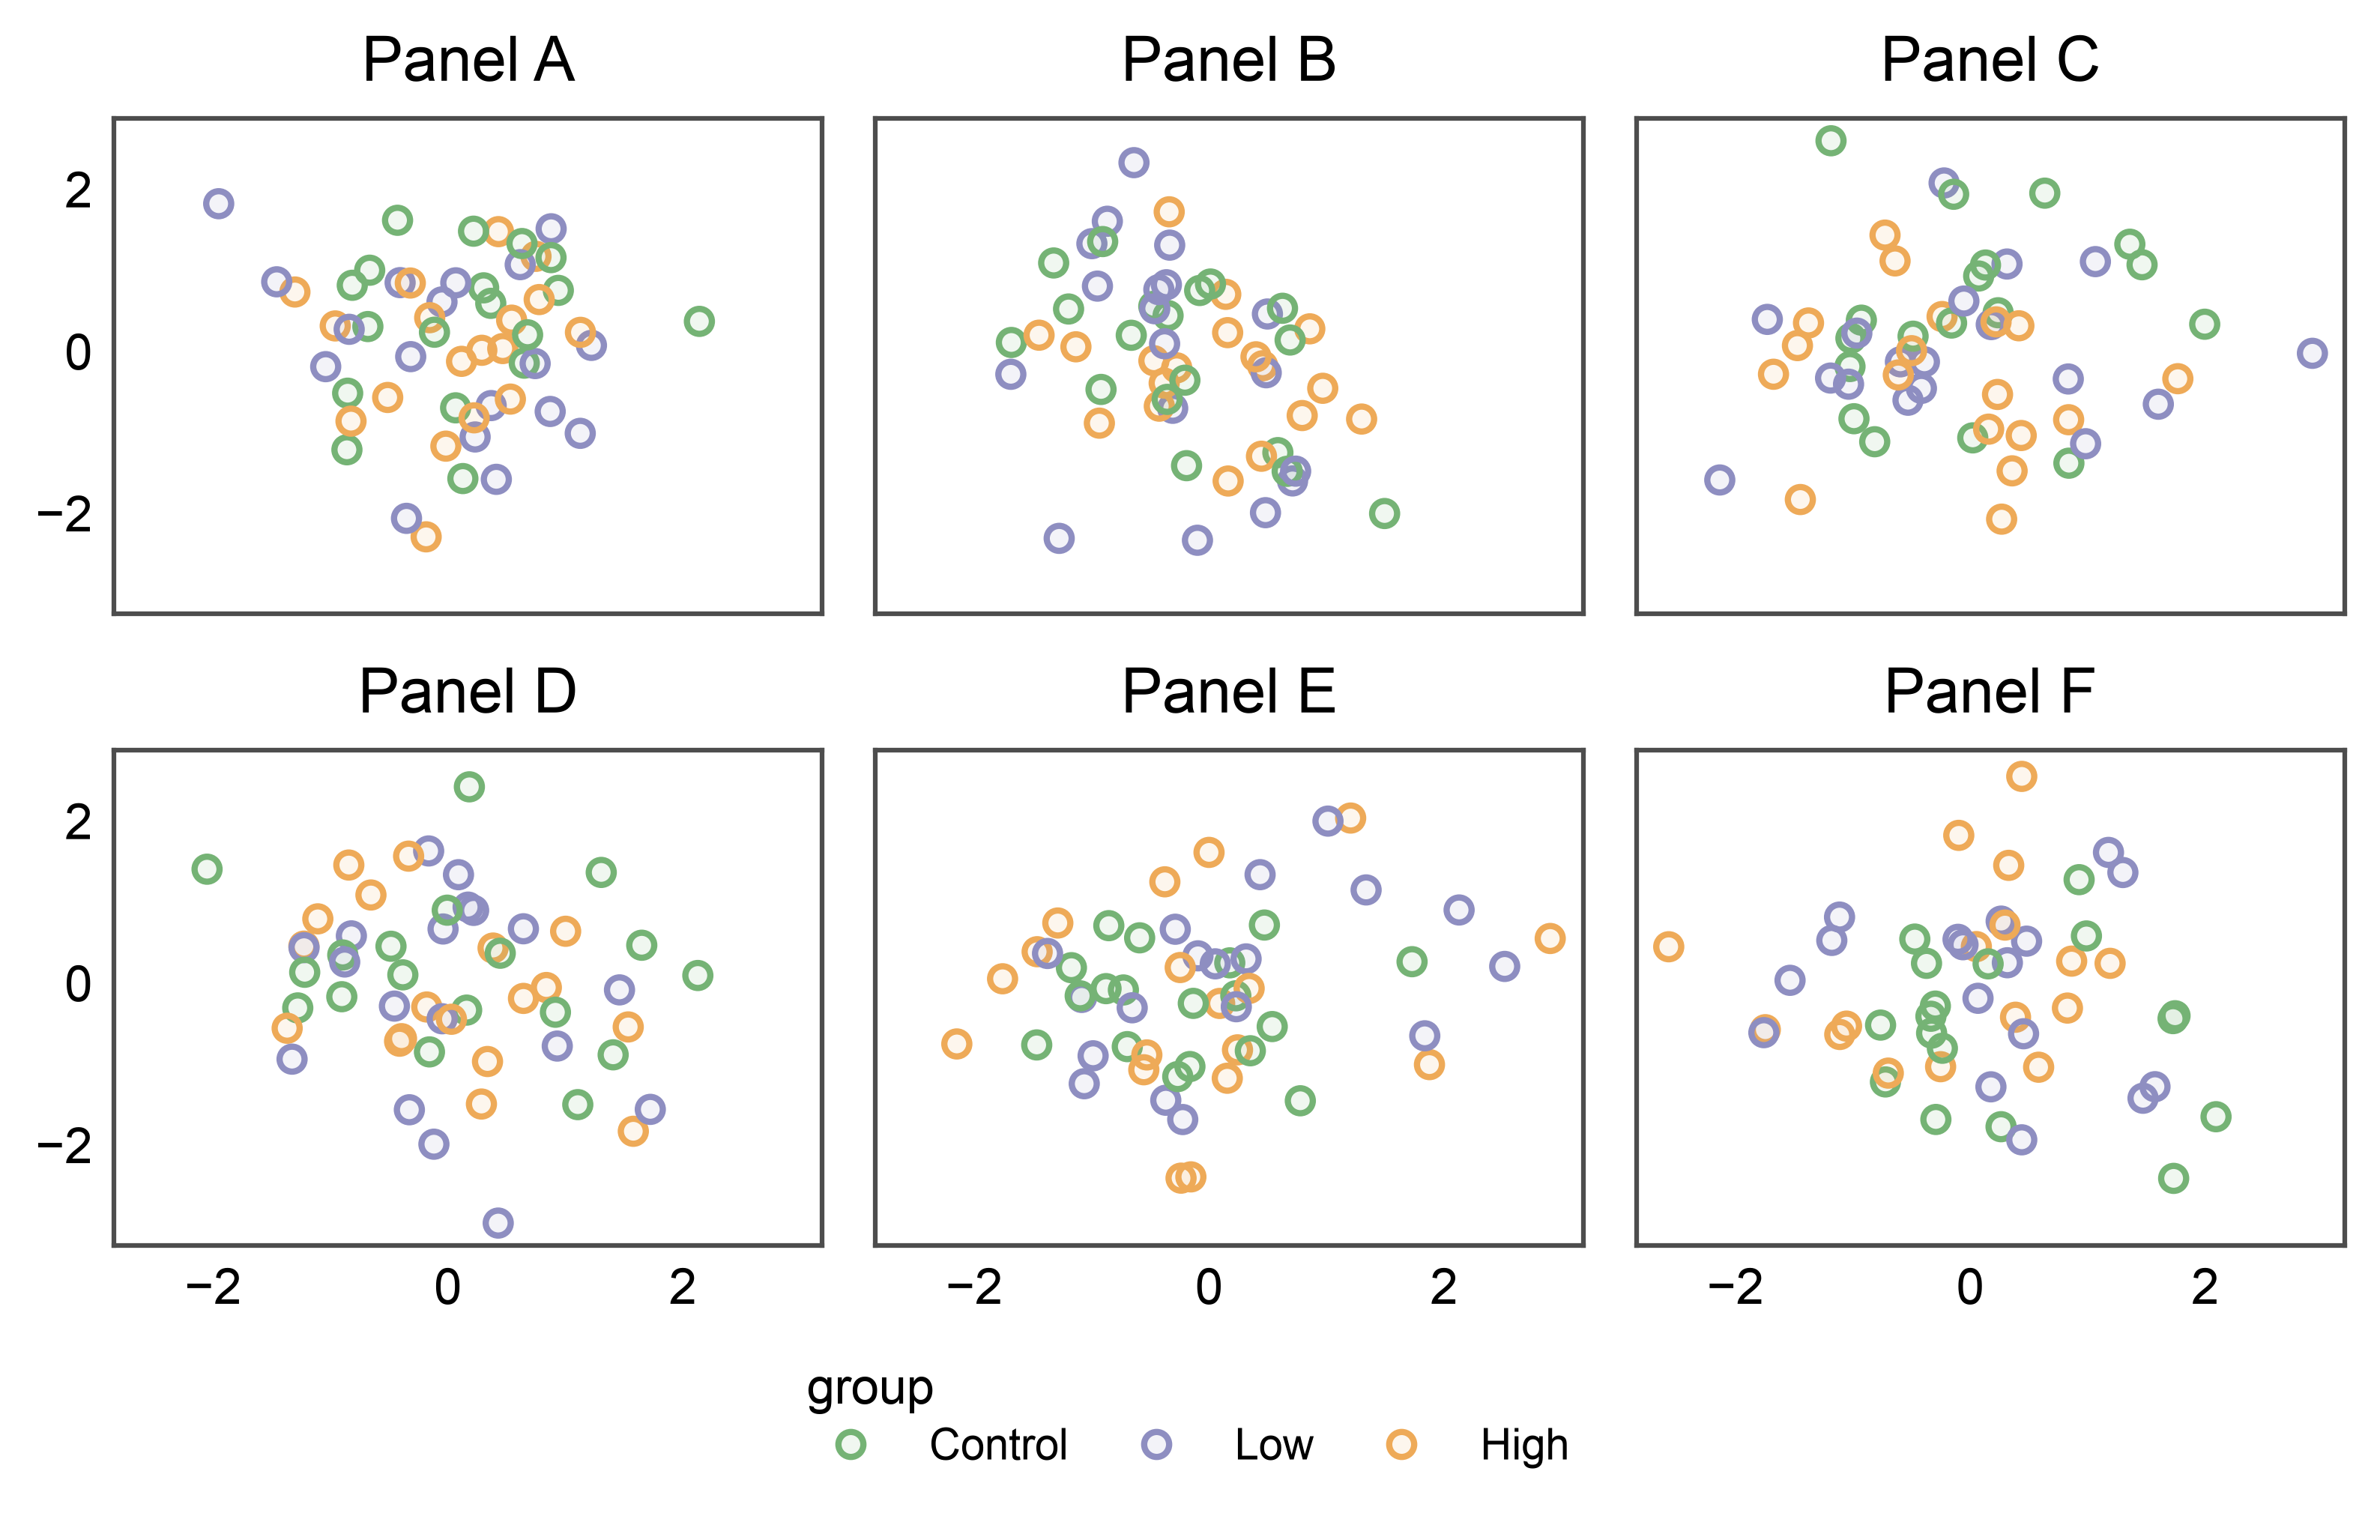
5. Outer labels + a shared legend band
Outer-only labeling composes with the legend bands from the
legend placement gallery. Here a
shared side="bottom" legend collects the per-panel entries into a
single band below a grid whose interior labels are hidden — the bottom
row keeps its x label, and the band tucks in below it without fighting
for space.
fig, axes = pp.subplots(2, 3, axes_size=(40, 28), sharex=True, sharey=True)
pp.legend(side="bottom")
for (r, c), panel in zip(
    [(0, 0), (0, 1), (0, 2), (1, 0), (1, 1), (1, 2)], "ABCDEF"
):
    pp.scatterplot(
        data=_df[_df["panel"] == panel], x="x", y="y",
        hue="group", palette="pastel",
        title=f"Panel {panel}", ax=axes[r, c],
    )
pp.show()
Total running time of the script: (0 minutes 15.607 seconds)