Note
Go to the end to download the full example code.
Raincloud Plot Examples
This example demonstrates raincloud plot functionality in PubliPlots, which combines violin plots (clouds), box plots (umbrellas), and strip/swarm plots (rain) to show both distribution shapes and individual data points.
Examples
import publiplots as pp
import pandas as pd
import numpy as np
Simple Raincloud Plot
Basic raincloud plot showing distribution by category.
# Create sample data
np.random.seed(42)
raincloud_data = pd.DataFrame({
    'time': np.repeat(['Day 1', 'Day 3', 'Day 7'], 40),
    'group': np.tile(np.repeat(['Control', 'Treated'], 20), 3),
    'measurement': np.concatenate([
        np.random.normal(50, 8, 20), np.random.normal(52, 8, 20),
        np.random.normal(52, 9, 20), np.random.normal(70, 12, 20),
        np.random.normal(55, 10, 20), np.random.normal(85, 14, 20),
    ])
})


# Create simple raincloud plot
ax = pp.raincloudplot(
    data=raincloud_data,
    x='time',
    y='measurement',
    title='Simple Raincloud Plot',
    xlabel='Time',
    ylabel='Measurement',
    cloud_alpha=0.6,
)
pp.show()

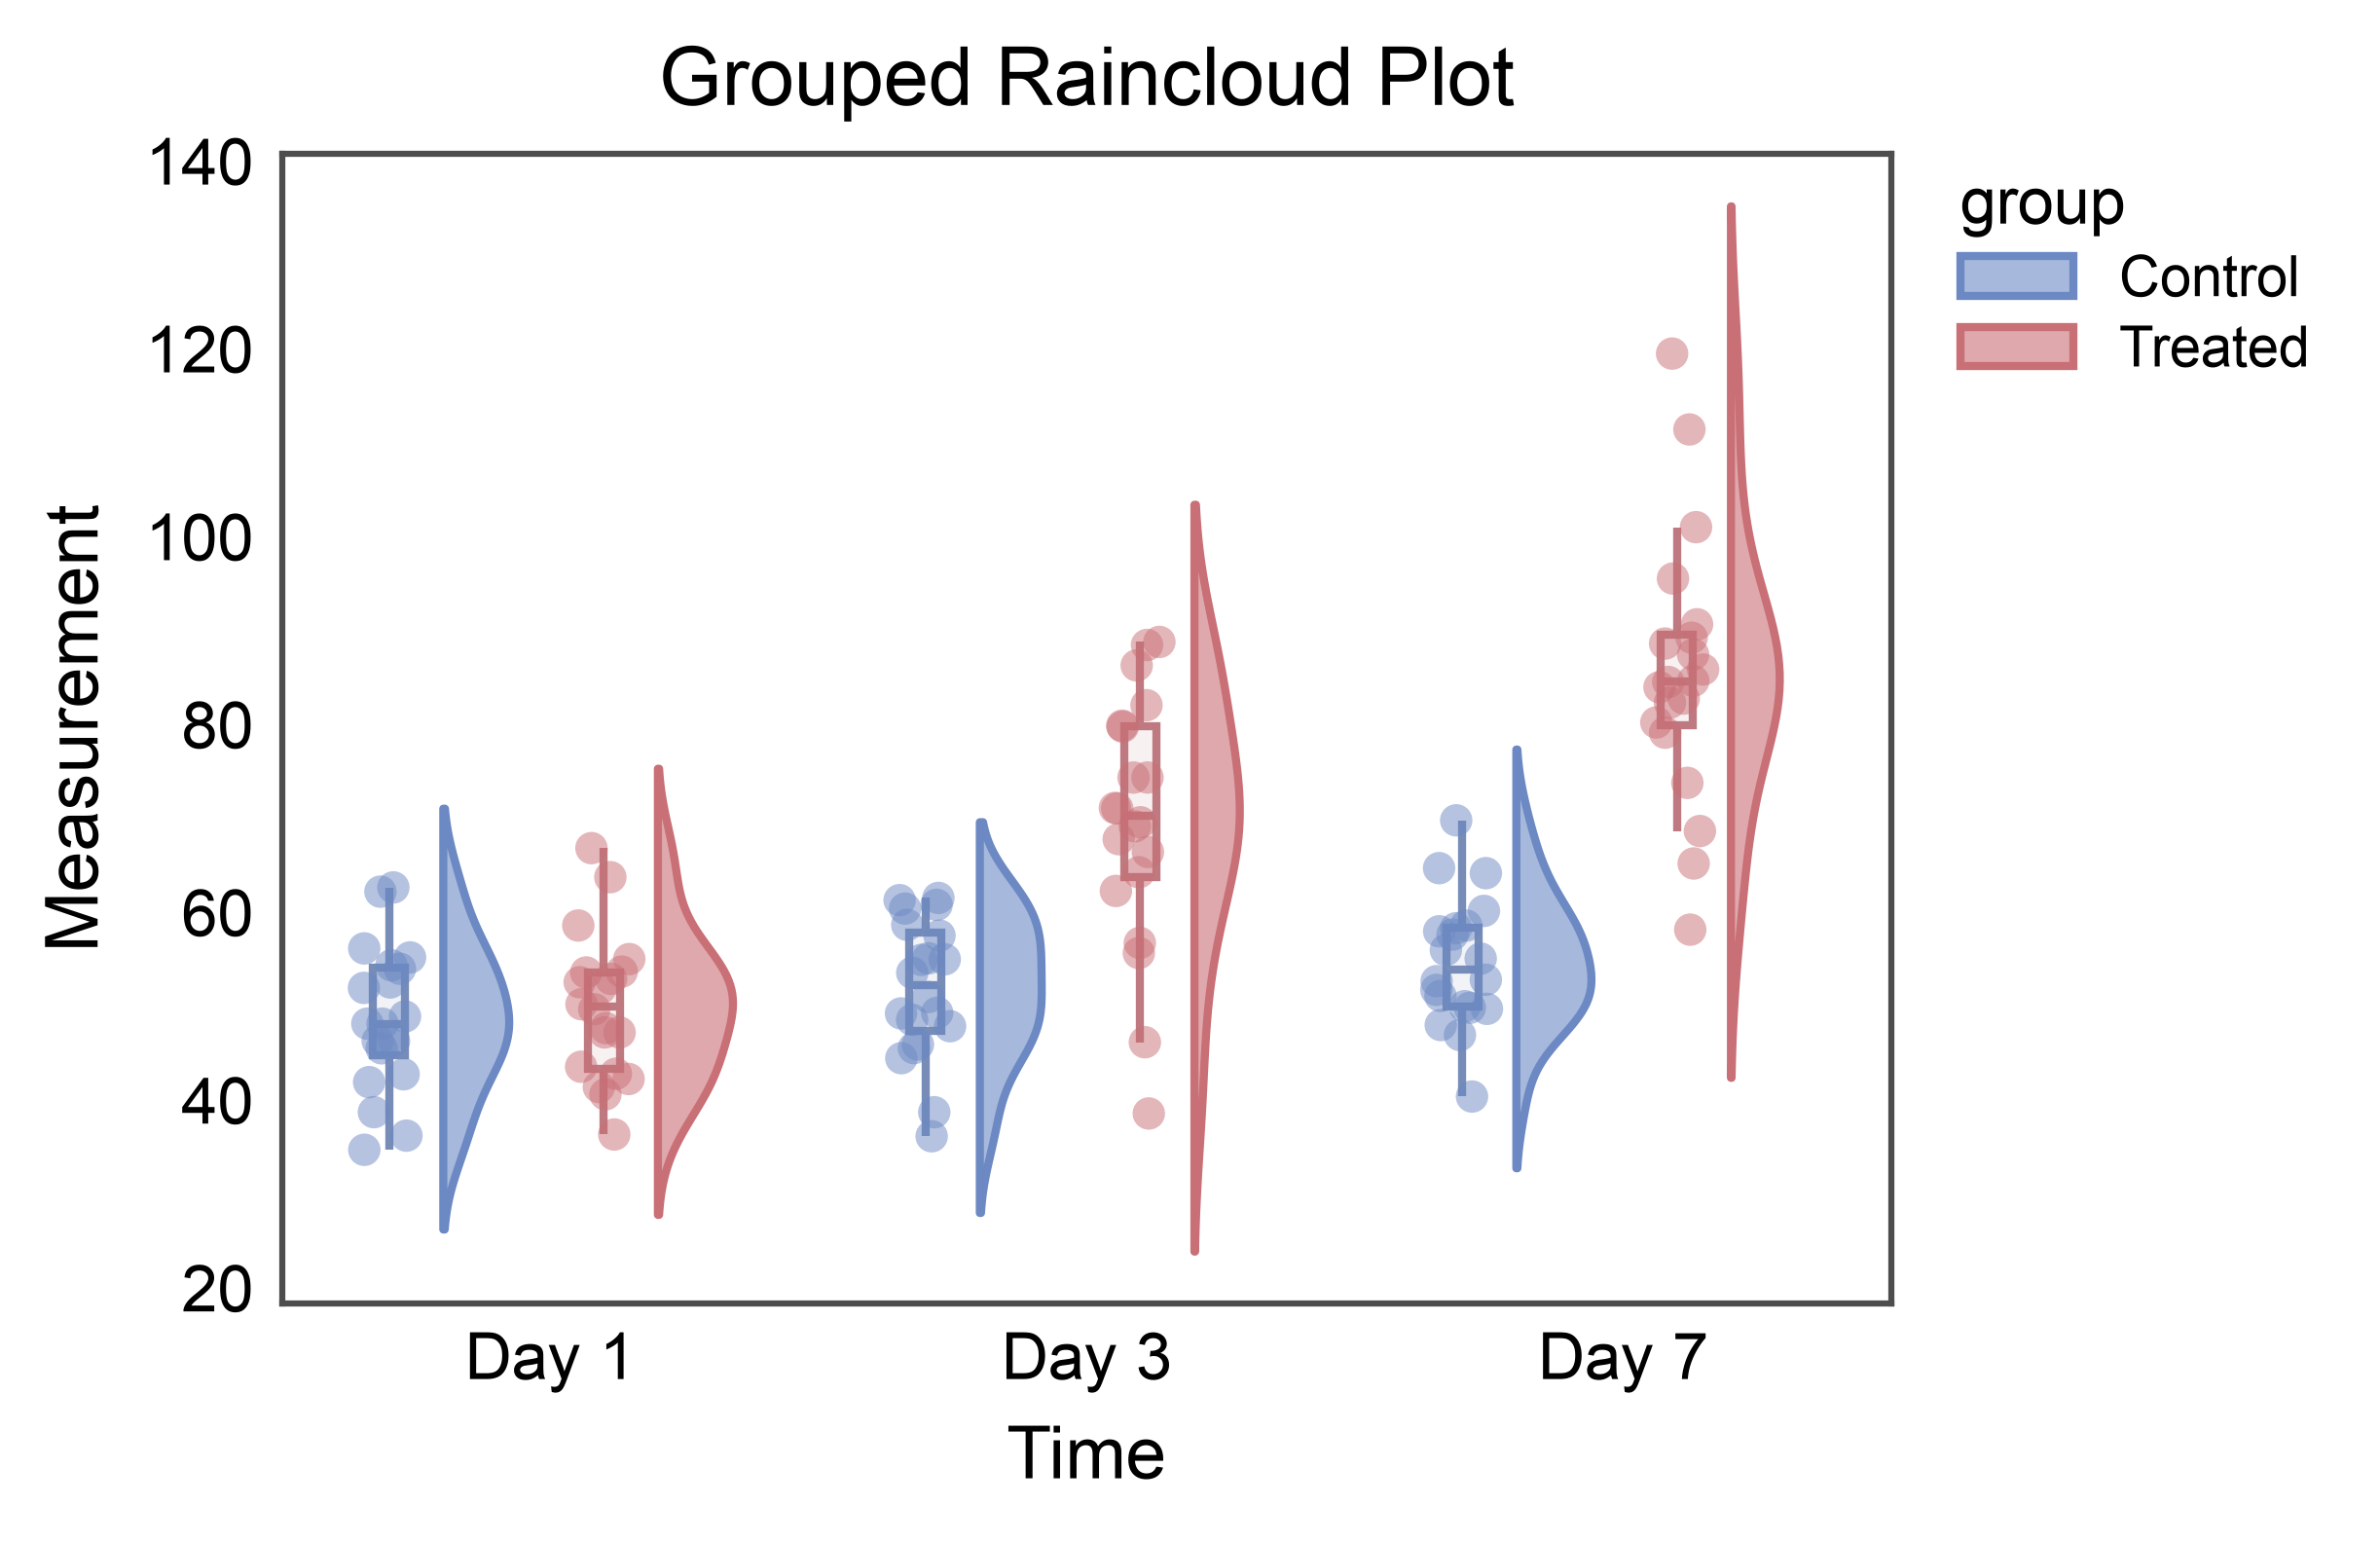
Raincloud Plot with Hue Grouping (Vertical)
Use the hue parameter to create grouped raincloud plots.
# Create grouped raincloud plot
ax = pp.raincloudplot(
    data=raincloud_data,
    x='time',
    y='measurement',
    hue='group',
    title='Grouped Raincloud Plot',
    xlabel='Time',
    ylabel='Measurement',
    cloud_alpha=0.6,
    palette="RdGyBu_r",
    box_offset=0.1,
    rain_offset=0.1,
)
pp.show()
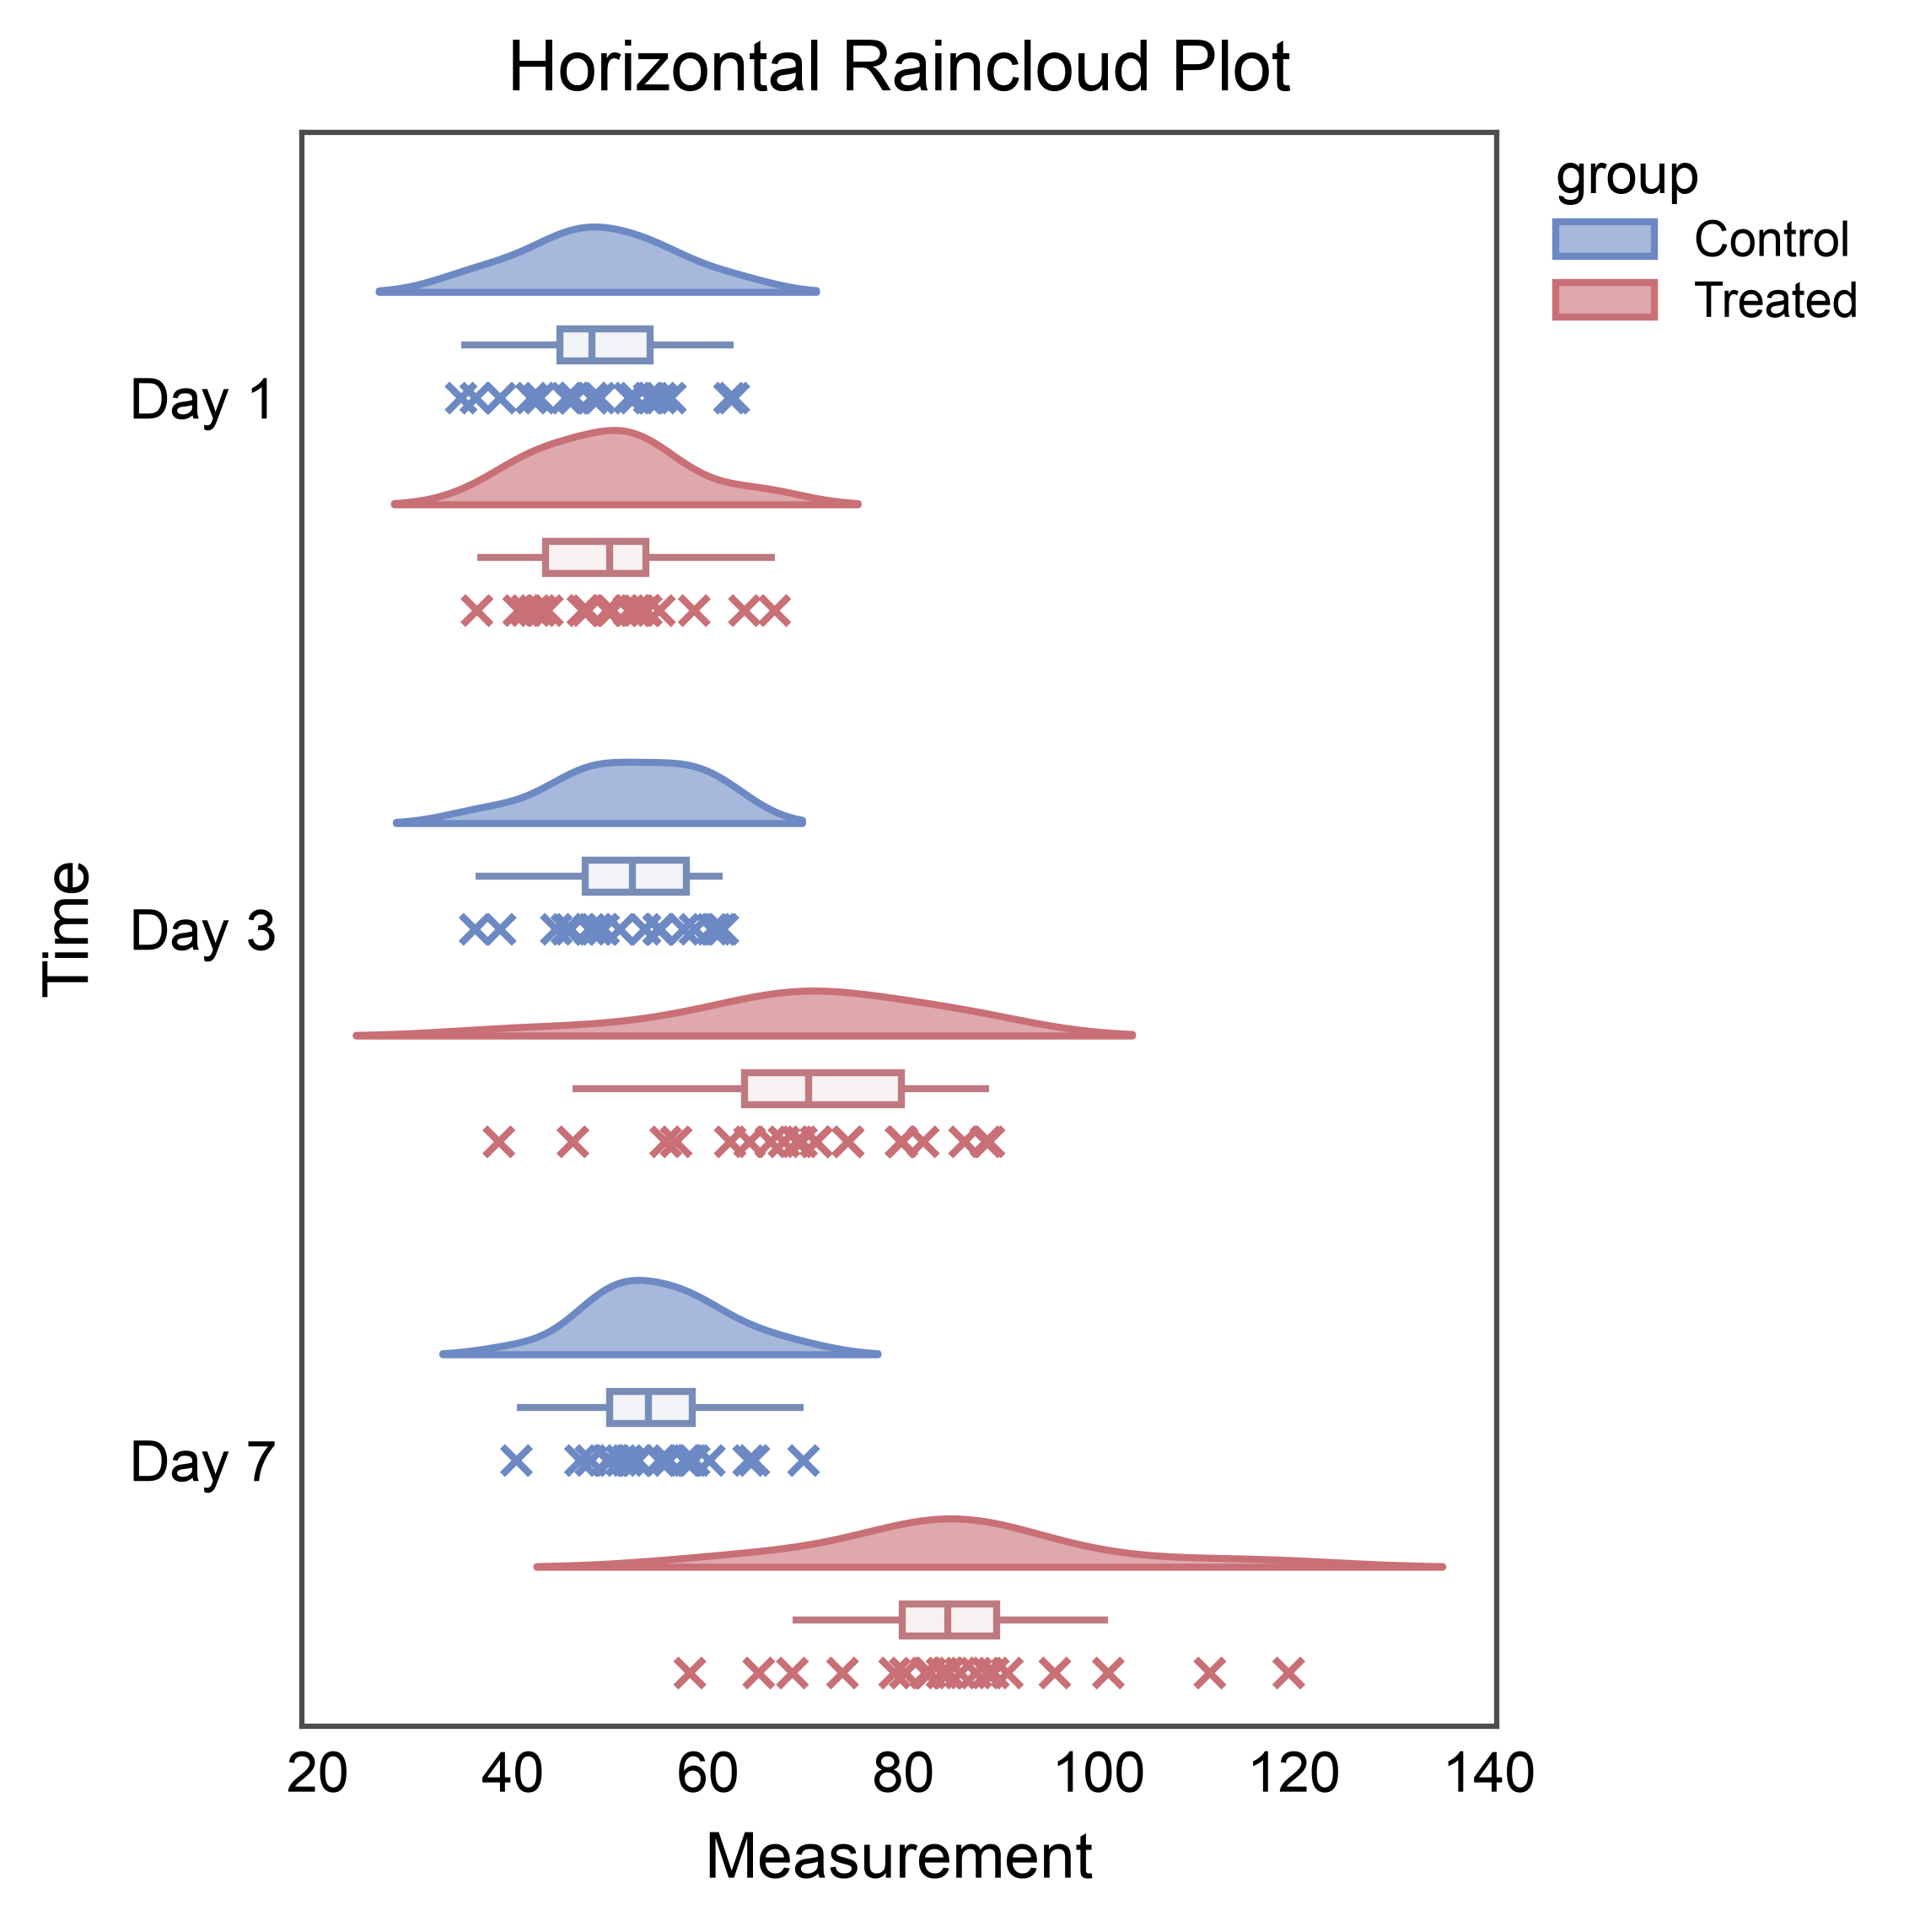
Horizontal Raincloud Plot with Hue
Create horizontal raincloud plots by swapping x and y.
# Horizontal raincloud needs a tall axes area; compose with pp.subplots
# instead of passing figsize=.
fig, ax = pp.subplots(axes_size=(60, 80))
pp.raincloudplot(
    data=raincloud_data,
    x='measurement',
    y='time',
    hue='group',
    cloud_side="left",
    title='Horizontal Raincloud Plot',
    xlabel='Measurement',
    ylabel='Time',
    cloud_alpha=0.6,
    palette="RdGyBu_r",
    box_offset=0.1,
    rain_offset=0.2,
    rain_kws=dict(
        linewidth=1,
        alpha=0.5,
        jitter=False,
        marker="x"
    ),
    ax=ax,
)
pp.show()
Customization
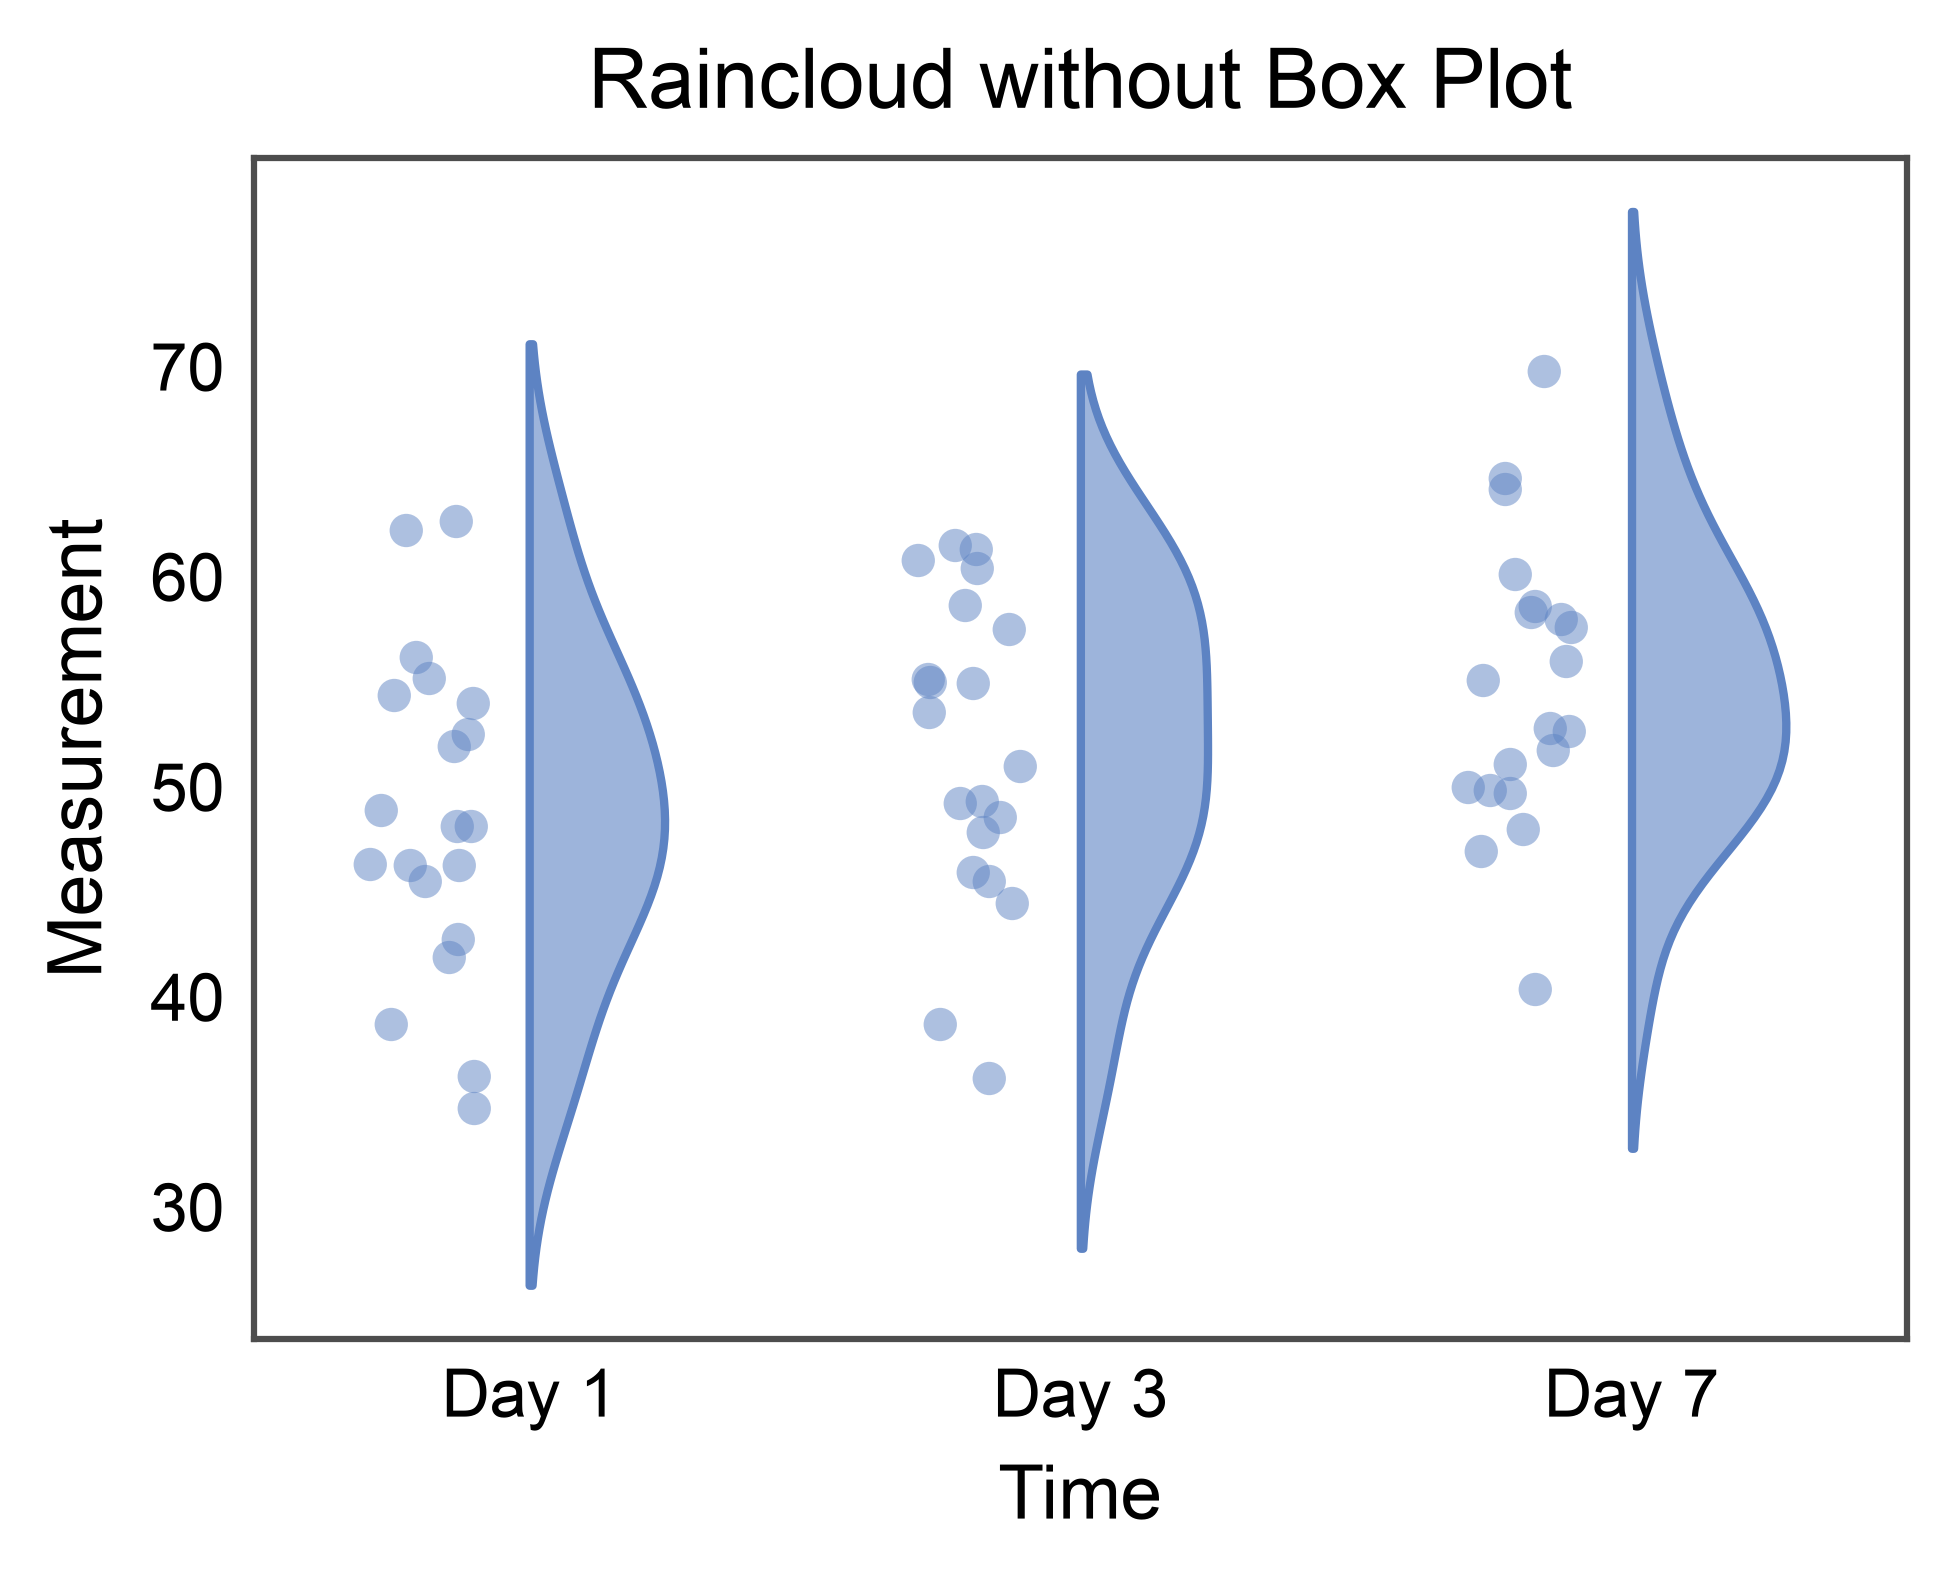
Raincloud Plot Without Box
Create raincloud plot with only cloud and rain elements.
ax = pp.raincloudplot(
    data=raincloud_data[raincloud_data['group'] == 'Control'],
    x='time',
    y='measurement',
    box=False,
    title='Raincloud without Box Plot',
    xlabel='Time',
    ylabel='Measurement',
    cloud_alpha=0.6,
)
pp.show()
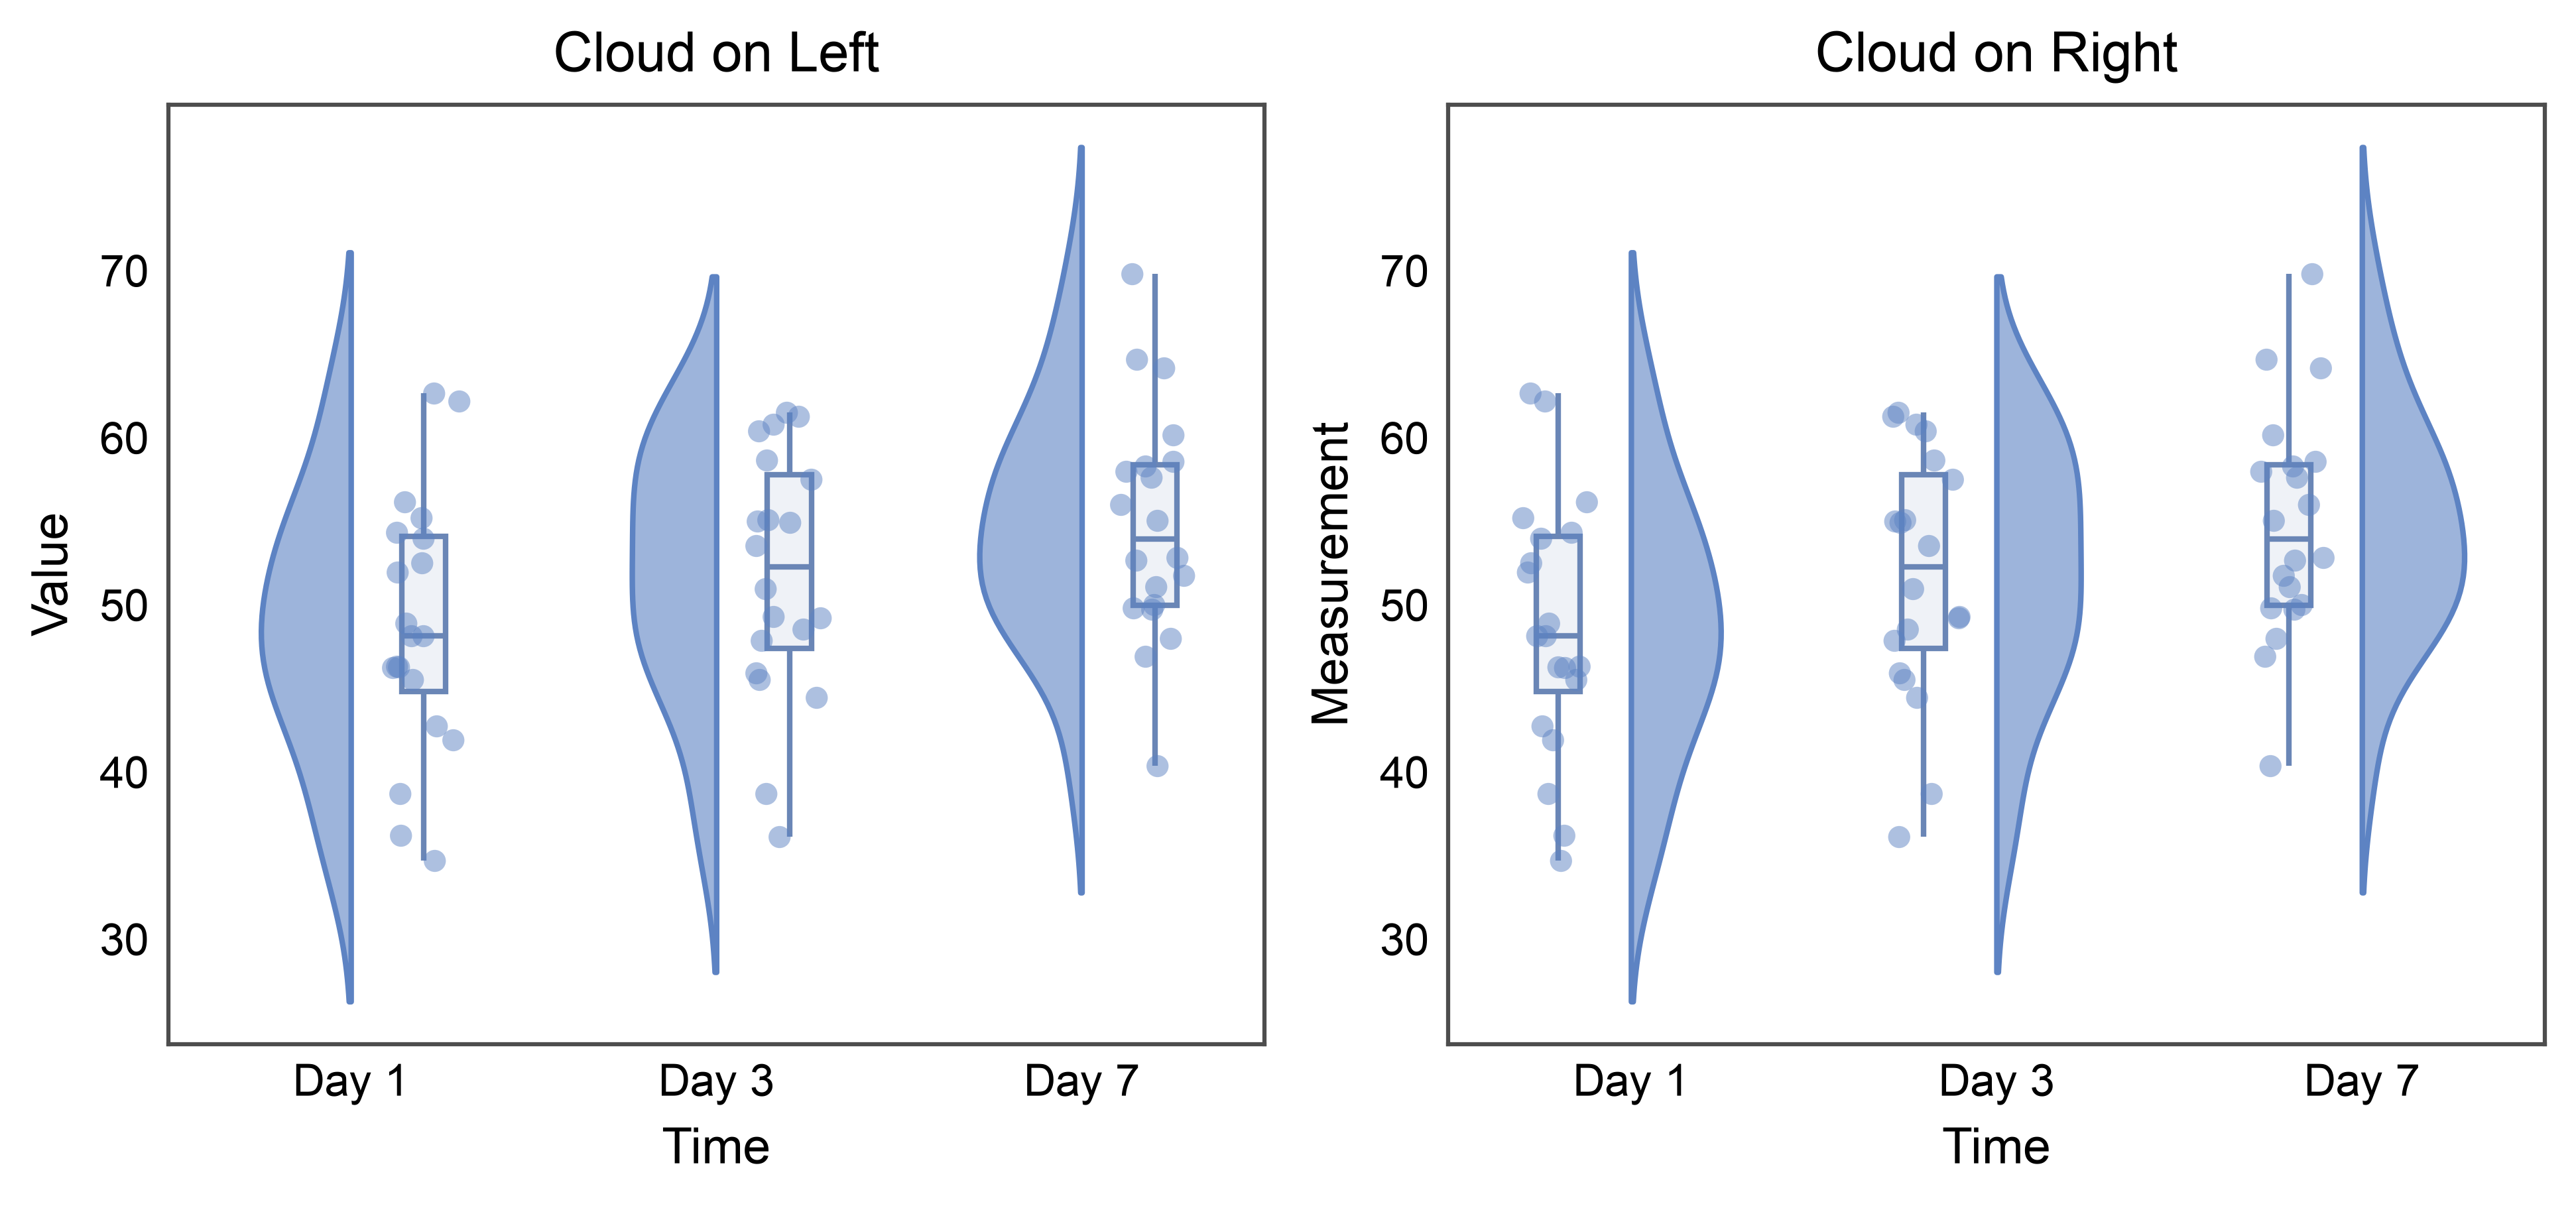
Raincloud Plot with Custom Cloud Side
Control which side the cloud appears on.
fig, axes = pp.subplots(1, 2, axes_size=(70, 60))

# Cloud on the left
pp.raincloudplot(
    data=raincloud_data[raincloud_data['group'] == 'Control'],
    x='time',
    y='measurement',
    cloud_side='left',
    ax=axes[0],
    title='Cloud on Left',
    xlabel='Time',
    ylabel='Value',
    cloud_alpha=0.6,
)

# Cloud on the right (default)
pp.raincloudplot(
    data=raincloud_data[raincloud_data['group'] == 'Control'],
    x='time',
    y='measurement',
    cloud_side='right',
    ax=axes[1],
    title='Cloud on Right',
    xlabel='Time',
    ylabel='Measurement',
    cloud_alpha=0.6,
)

pp.show()
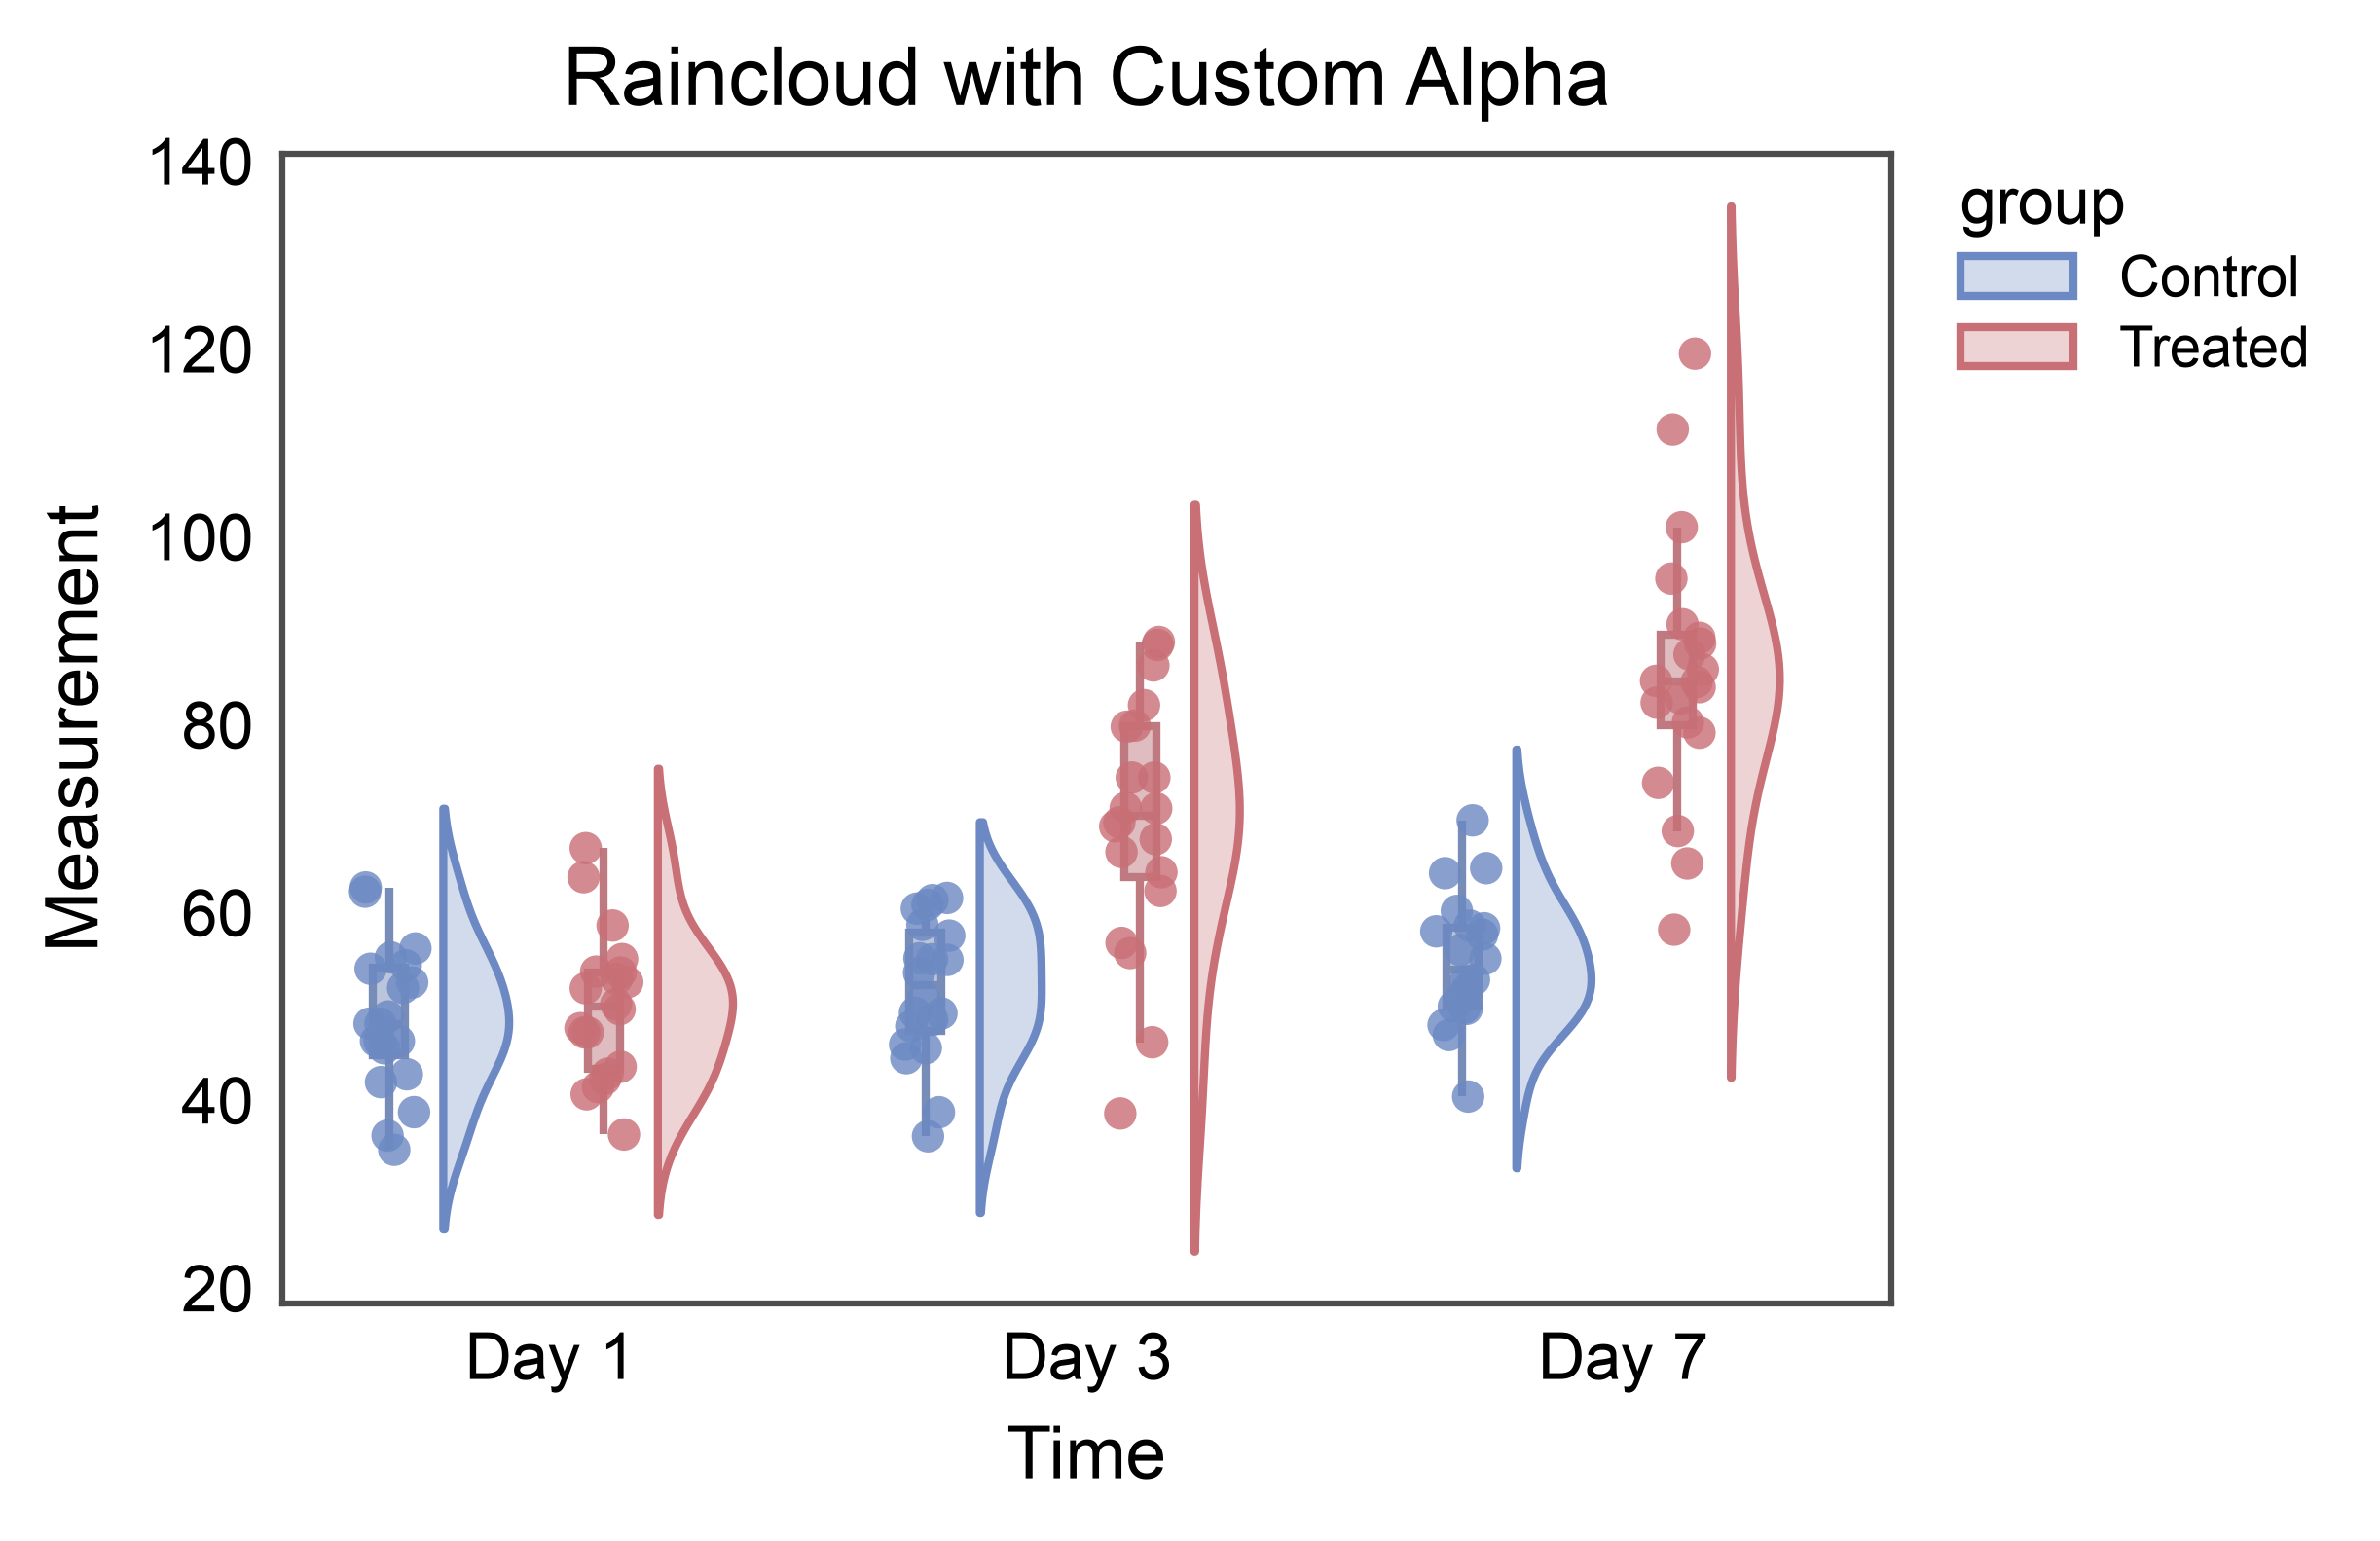
Raincloud Plot with Custom Alpha Values
Adjust transparency of different components.
ax = pp.raincloudplot(
    data=raincloud_data,
    x='time',
    y='measurement',
    hue='group',
    title='Raincloud with Custom Alpha',
    xlabel='Time',
    ylabel='Measurement',
    cloud_alpha=0.3,
    box_kws=dict(alpha=0.5),
    rain_kws=dict(alpha=0.8, linewidth=0),
    palette="RdGyBu_r",
    box_offset=0.1,
    rain_offset=0.1,
)
pp.show()
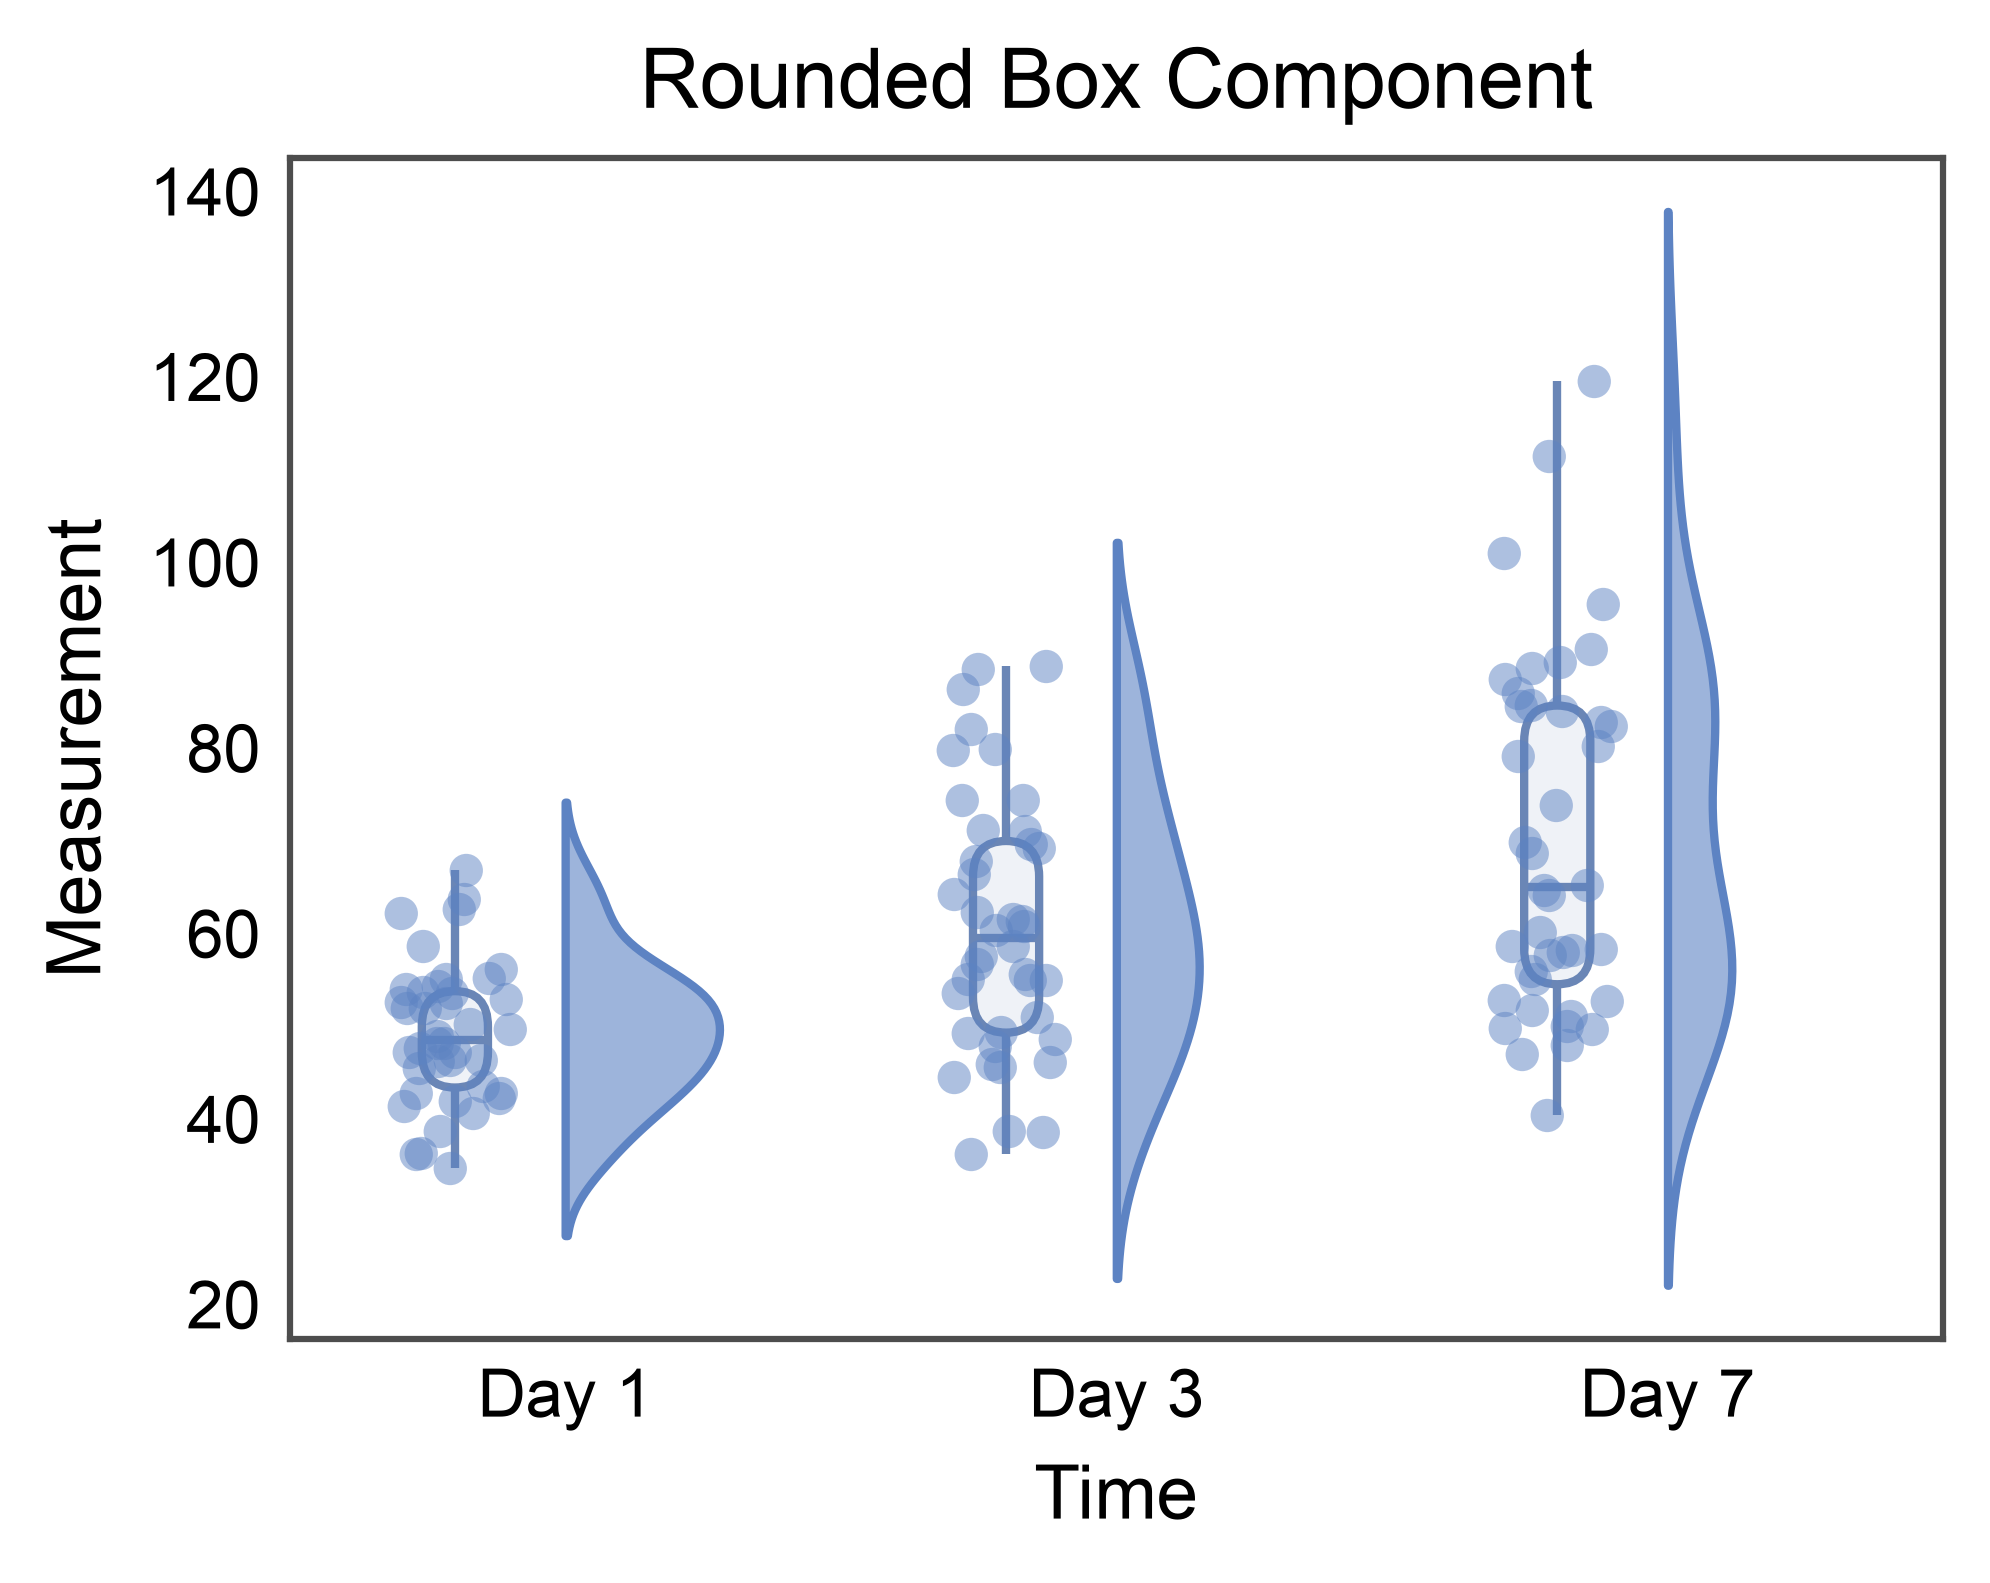
Rounded inner-box via box.border_radius
New in 0.10.6: pp.raincloudplot composes violin + box + strip, and
the box component is drawn by pp.boxplot internally. Setting the
box.border_radius rcParam rounds the raincloud’s IQR box
automatically — no special wiring. The rcParam is restored after the
demo so downstream gallery sections see the default flat box.
pp.rcParams["box.border_radius"] = 1.5
try:
    ax = pp.raincloudplot(
        data=raincloud_data,
        x='time',
        y='measurement',
        title='Rounded Box Component',
        xlabel='Time',
        ylabel='Measurement',
        cloud_alpha=0.6,
    )
    pp.show()
finally:
    pp.rcParams["box.border_radius"] = (0.0, 0.0)
Total running time of the script: (0 minutes 4.399 seconds)