Note
Go to the end to download the full example code.
Edge Color Control
This example demonstrates how to control edge color across all plot types,
either globally through pp.rcParams['edgecolor'] or per-call via the
edgecolor= argument.
By default, pp.rcParams['edgecolor'] is None, which means each plot
picks its own edge automatically (typically the face/palette color). Setting
it once applies uniform edges across every plot in the figure.
import publiplots as pp
import pandas as pd
import numpy as np

# Use a higher alpha for this example so face colors are vivid — it makes
# edge colors easier to spot by contrast.
pp.rcParams['alpha'] = 0.8
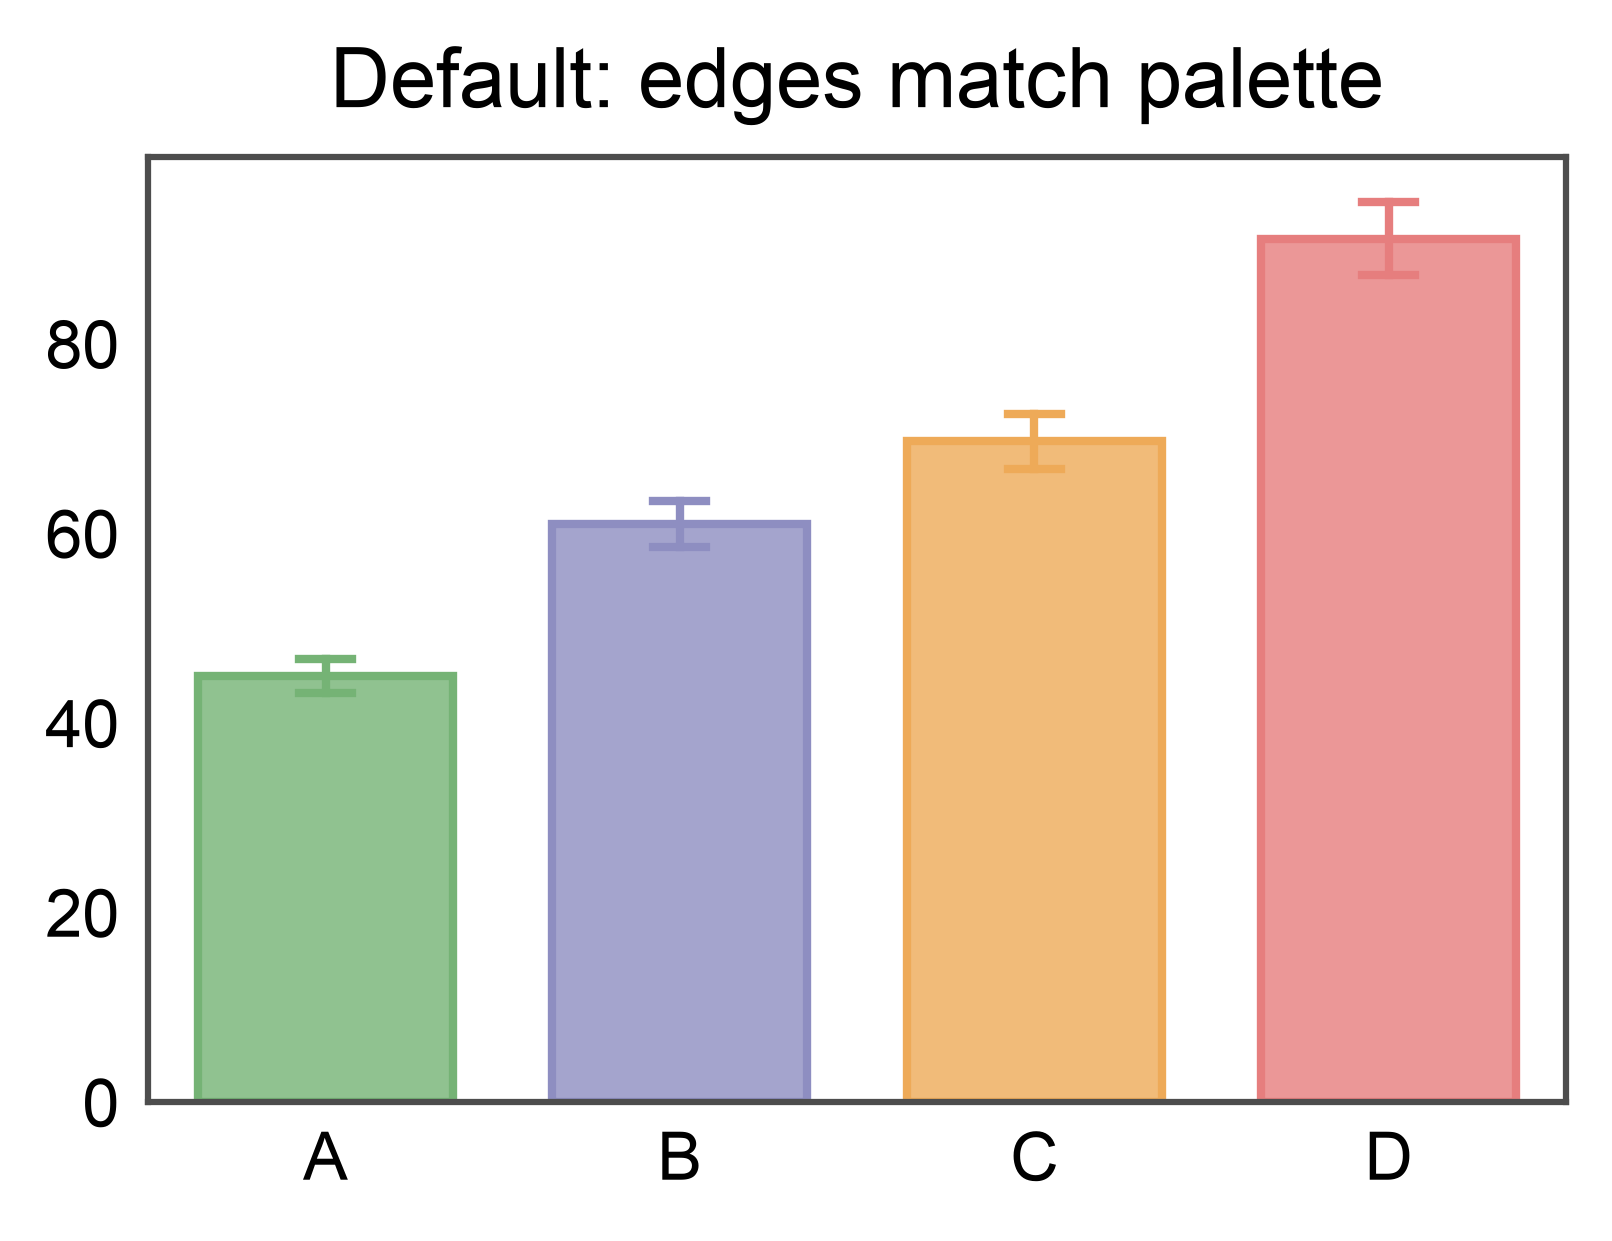
Default Behavior: Automatic Edges
With the default rcParam (None), edges match the face color. Each bar’s
outline follows its palette entry.
np.random.seed(7)
bar_data = pd.DataFrame({
    'group': np.repeat(['A', 'B', 'C', 'D'], 12),
    'value': np.concatenate([
        np.random.normal(45, 7, 12),
        np.random.normal(60, 8, 12),
        np.random.normal(75, 9, 12),
        np.random.normal(90, 10, 12),
    ])
})

fig, ax = pp.subplots(axes_size=(60, 40))
pp.barplot(
    data=bar_data,
    x='group',
    y='value',
    hue='group',
    palette='pastel',
    errorbar='se',
    title='Default: edges match palette',
    ax=ax,
)
pp.show()
Global Override via rcParams
Set pp.rcParams['edgecolor'] to apply a single edge color across every
plot in the script. This is the recommended way to enforce a consistent
publication style without repeating edgecolor= on every call.
pp.rcParams['edgecolor'] = 'black'

fig, ax = pp.subplots(axes_size=(60, 40))
pp.barplot(
    data=bar_data,
    x='group',
    y='value',
    hue='group',
    palette='pastel',
    errorbar='se',
    title="rcParams['edgecolor'] = 'black'",
    ax=ax,
)
pp.show()
![rcParams['edgecolor'] = 'black'](../_images/sphx_glr_plot_22_edgecolor_control_002.png)
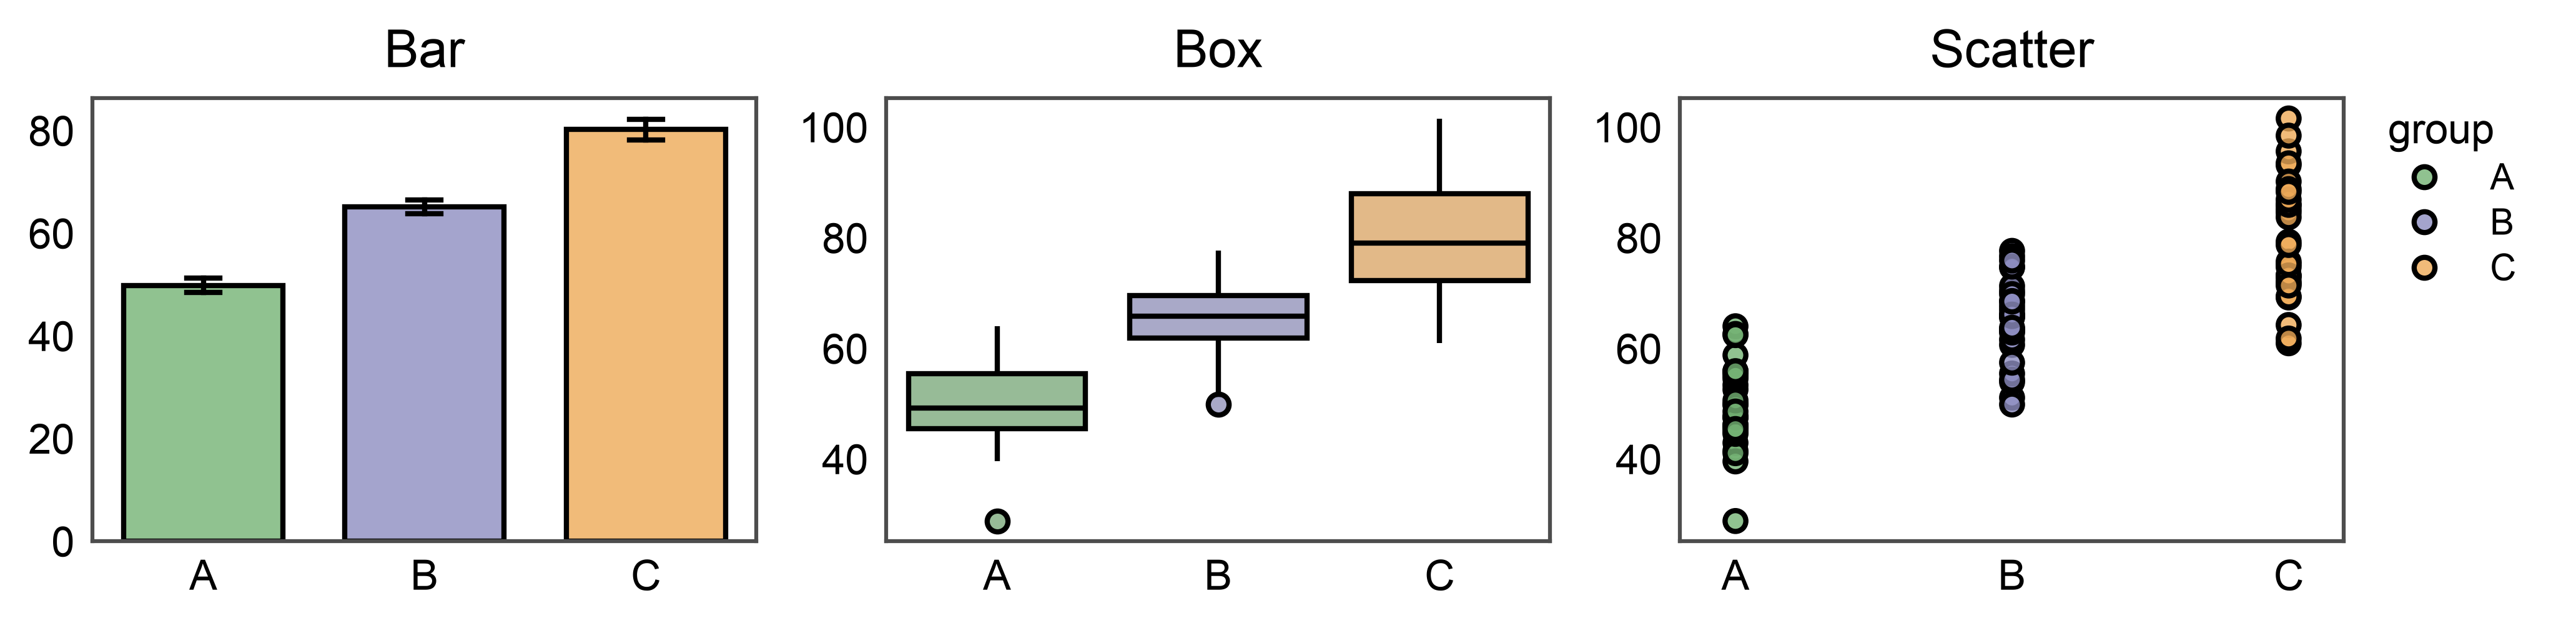
Uniform Edges Across Plot Types
The same rcParam applies to every publiplots function: bars, boxes, violins, scatter, strip/swarm, point, raincloud, and dot-heatmaps.
np.random.seed(11)
mixed_data = pd.DataFrame({
    'group': np.repeat(['A', 'B', 'C'], 30),
    'value': np.concatenate([
        np.random.normal(50, 8, 30),
        np.random.normal(65, 9, 30),
        np.random.normal(80, 10, 30),
    ]),
})

# `pp.subplots` declares axes dimensions in mm and extends the figure to
# accommodate decorations. `pp.legend_group` reserves a shared legend
# column on the right whose width is auto-measured from the rendered
# entries — no manual `legend_column=...` guess.
#
# `pp.legend(anchor=...)` attaches BEFORE the plot calls. Plotting
# functions that stash entries (scatterplot, stripplot, swarmplot,
# pointplot in this release) see the group and skip their own per-axis
# legend — the group claims and renders their entries instead.
#
# For plots that don't yet stash (bar, box), we pass `legend=False`; the
# scatterplot on the right anchors the shared "group" entry for the whole
# row since all three panels share the same hue variable.
fig, axes = pp.subplots(1, 3, axes_size=(45, 30))
pp.legend(anchor=axes[-1])

pp.barplot(
    data=mixed_data, x='group', y='value', hue='group',
    palette='pastel', errorbar='se', title='Bar', ax=axes[0], legend=False,
)
pp.boxplot(
    data=mixed_data, x='group', y='value', hue='group',
    palette='pastel', title='Box', ax=axes[1], legend=False,
)
pp.scatterplot(
    data=mixed_data, x='group', y='value', hue='group',
    palette='pastel', title='Scatter', ax=axes[2],
)
pp.show()
Composite Plots: Raincloud
Raincloud plots layer a violin (KDE cloud), a box, and a strip of raw points
in one figure. Before the rcParam, each layer had to be passed edgecolor
individually (or inherit palette edges per layer). Setting the rcParam once
gives every sub-artist the same outline, which reads much cleaner for
publications — especially across groups sharing a palette.
Note the rain_kws=dict(linewidth=0.5) override: the raincloud default
draws rain points with linewidth=0 for a clean look, but that also hides
any edge color. Pass a small positive linewidth to make the edge visible on
the individual points.
np.random.seed(21)
rain_data = pd.DataFrame({
    'condition': np.repeat(['Control', 'Low Dose', 'High Dose'], 40),
    'response': np.concatenate([
        np.random.normal(50, 8, 40),
        np.random.normal(62, 10, 40),
        np.random.normal(78, 9, 40),
    ]),
})

fig, axes = pp.subplots(1, 2, axes_size=(55, 50), sharey=True)

# Left: palette-driven edges (rcParam temporarily off)
pp.rcParams['edgecolor'] = None
pp.raincloudplot(
    data=rain_data,
    x='condition',
    y='response',
    hue='condition',
    palette='pastel',
    title='Auto edges (palette)',
    ax=axes[0],
    legend=False,
)

# Right: uniform black edges via rcParam + visible rain-point strokes.
pp.rcParams['edgecolor'] = 'black'
pp.raincloudplot(
    data=rain_data,
    x='condition',
    y='response',
    hue='condition',
    palette='pastel',
    rain_kws=dict(alpha=0.5, linewidth=0.5),
    title="rcParams['edgecolor'] = 'black'",
    ax=axes[1],
    legend=False,
)

# Both panels share the same groups, so one legend to the right of the
# rightmost axes serves both.
group = pp.legend(anchor=axes[-1])
group.add_legend(
    handles=pp.create_legend_handles(
        labels=['Control', 'Low Dose', 'High Dose'],
        colors=list(pp.color_palette('pastel', 3)),
        alpha=pp.rcParams['alpha'],
        linewidth=pp.rcParams['lines.linewidth'],
        edgecolors='black',
    ),
    label='condition',
)
pp.show()
![Auto edges (palette), rcParams['edgecolor'] = 'black'](../_images/sphx_glr_plot_22_edgecolor_control_004.png)
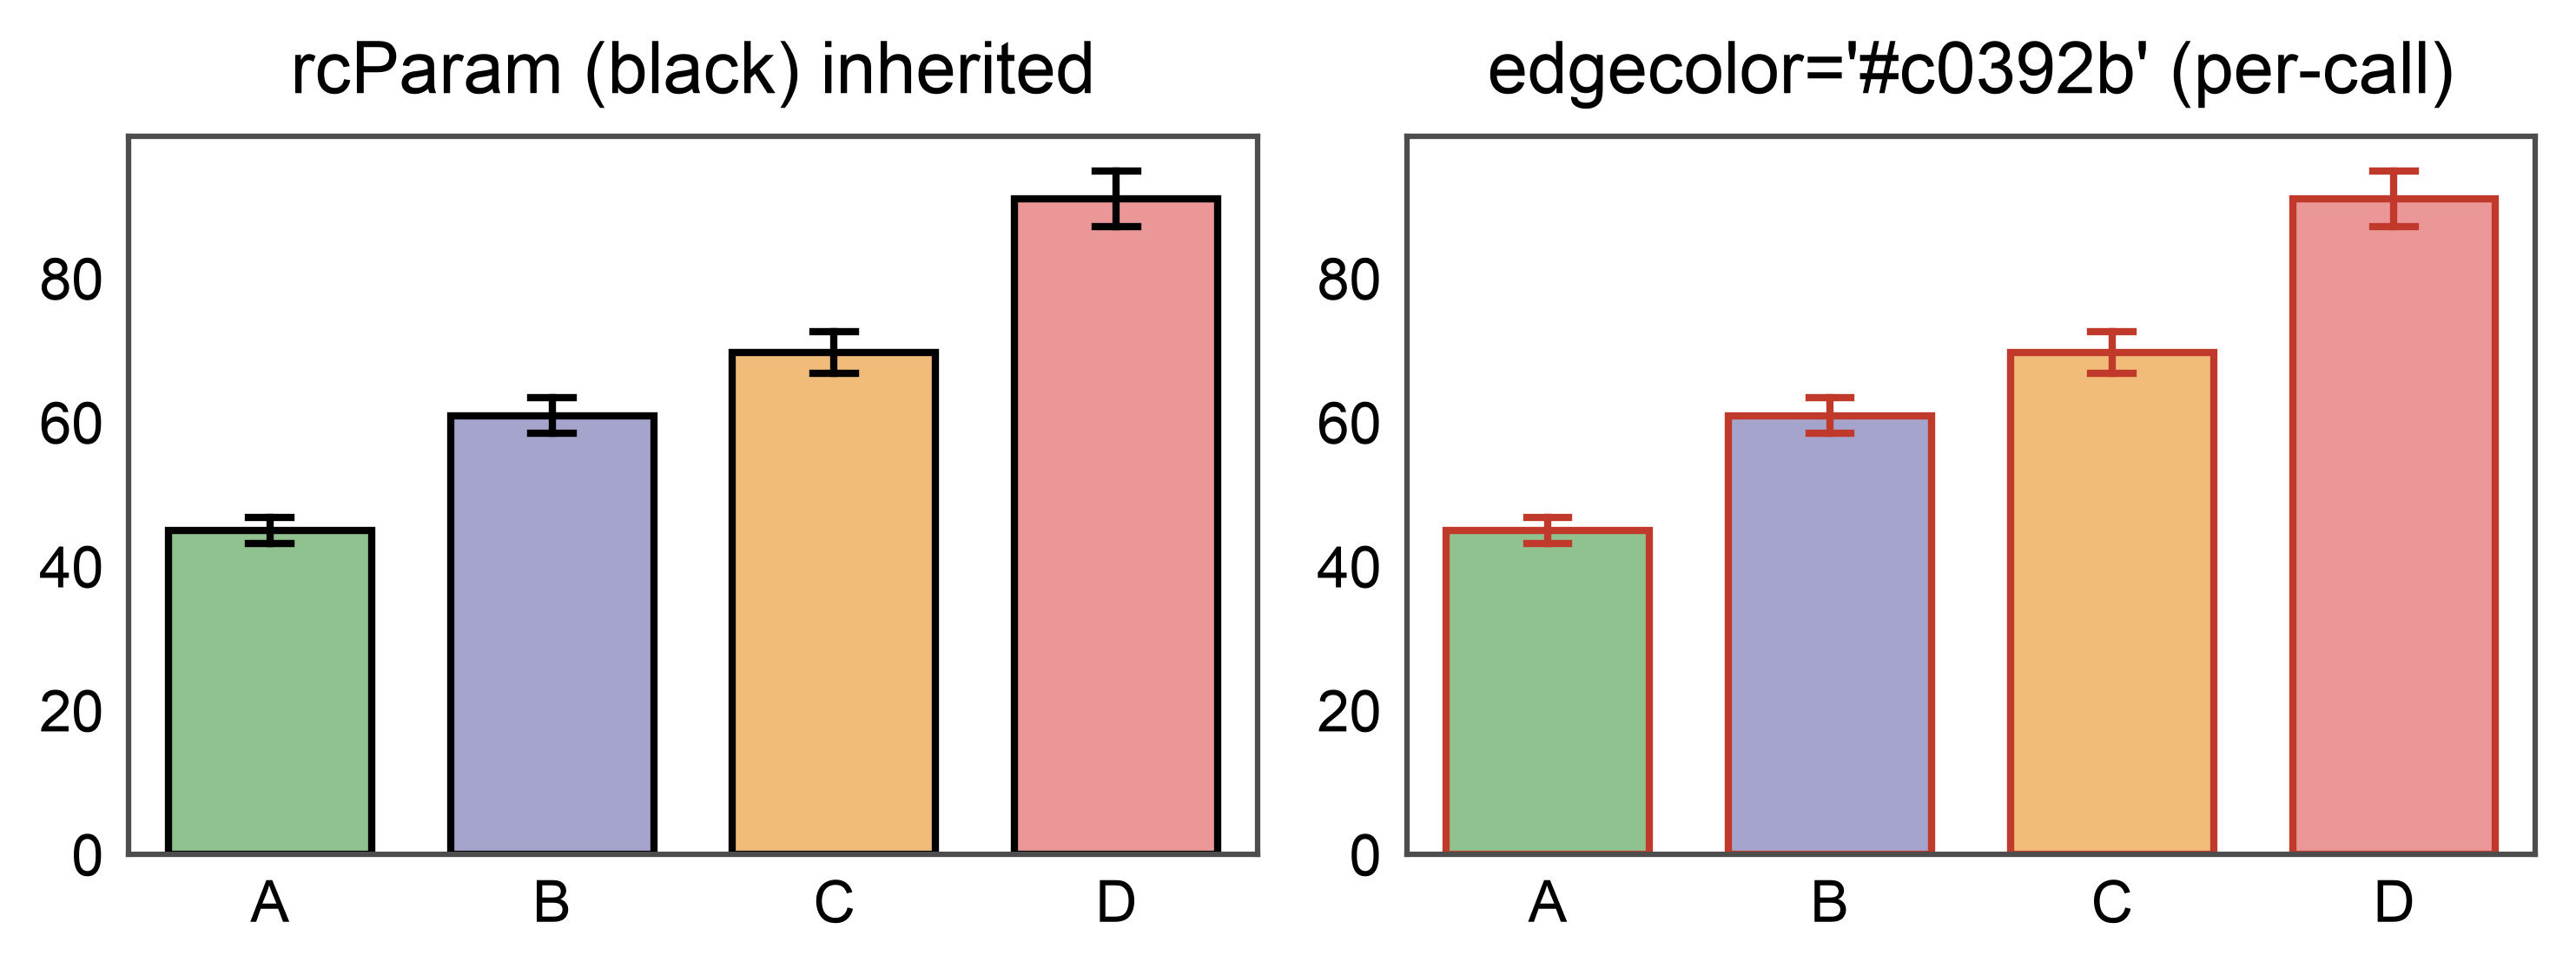
Per-Call Override
A per-call edgecolor= argument always wins over the rcParam. Use this
to tweak a single plot without resetting the global default.
fig, axes = pp.subplots(1, 2, axes_size=(55, 35))
pp.barplot(
    data=bar_data,
    x='group',
    y='value',
    hue='group',
    palette='pastel',
    errorbar='se',
    title="rcParam (black) inherited",
    ax=axes[0],
)
pp.barplot(
    data=bar_data,
    x='group',
    y='value',
    hue='group',
    palette='pastel',
    errorbar='se',
    edgecolor='#c0392b',
    title="edgecolor='#c0392b' (per-call)",
    ax=axes[1],
)
pp.show()
Restoring the Default
Set the rcParam back to None to return to per-plot automatic edges.
pp.rcParams['edgecolor'] = None

fig, ax = pp.subplots(axes_size=(60, 40))
pp.barplot(
    data=bar_data,
    x='group',
    y='value',
    hue='group',
    palette='pastel',
    errorbar='se',
    title="Back to default (None = auto)",
    ax=ax,
)
pp.show()

# Restore the global alpha default.
pp.rcParams['alpha'] = 0.1

Total running time of the script: (0 minutes 3.138 seconds)