Note
Go to the end to download the full example code.
Raincloud Plot Examples
This example demonstrates raincloud plot functionality in PubliPlots, which combines violin plots (clouds), box plots (umbrellas), and strip/swarm plots (rain) to show both distribution shapes and individual data points.
Examples
import publiplots as pp
import pandas as pd
import numpy as np
import matplotlib.pyplot as plt

# Set style
pp.set_notebook_style()
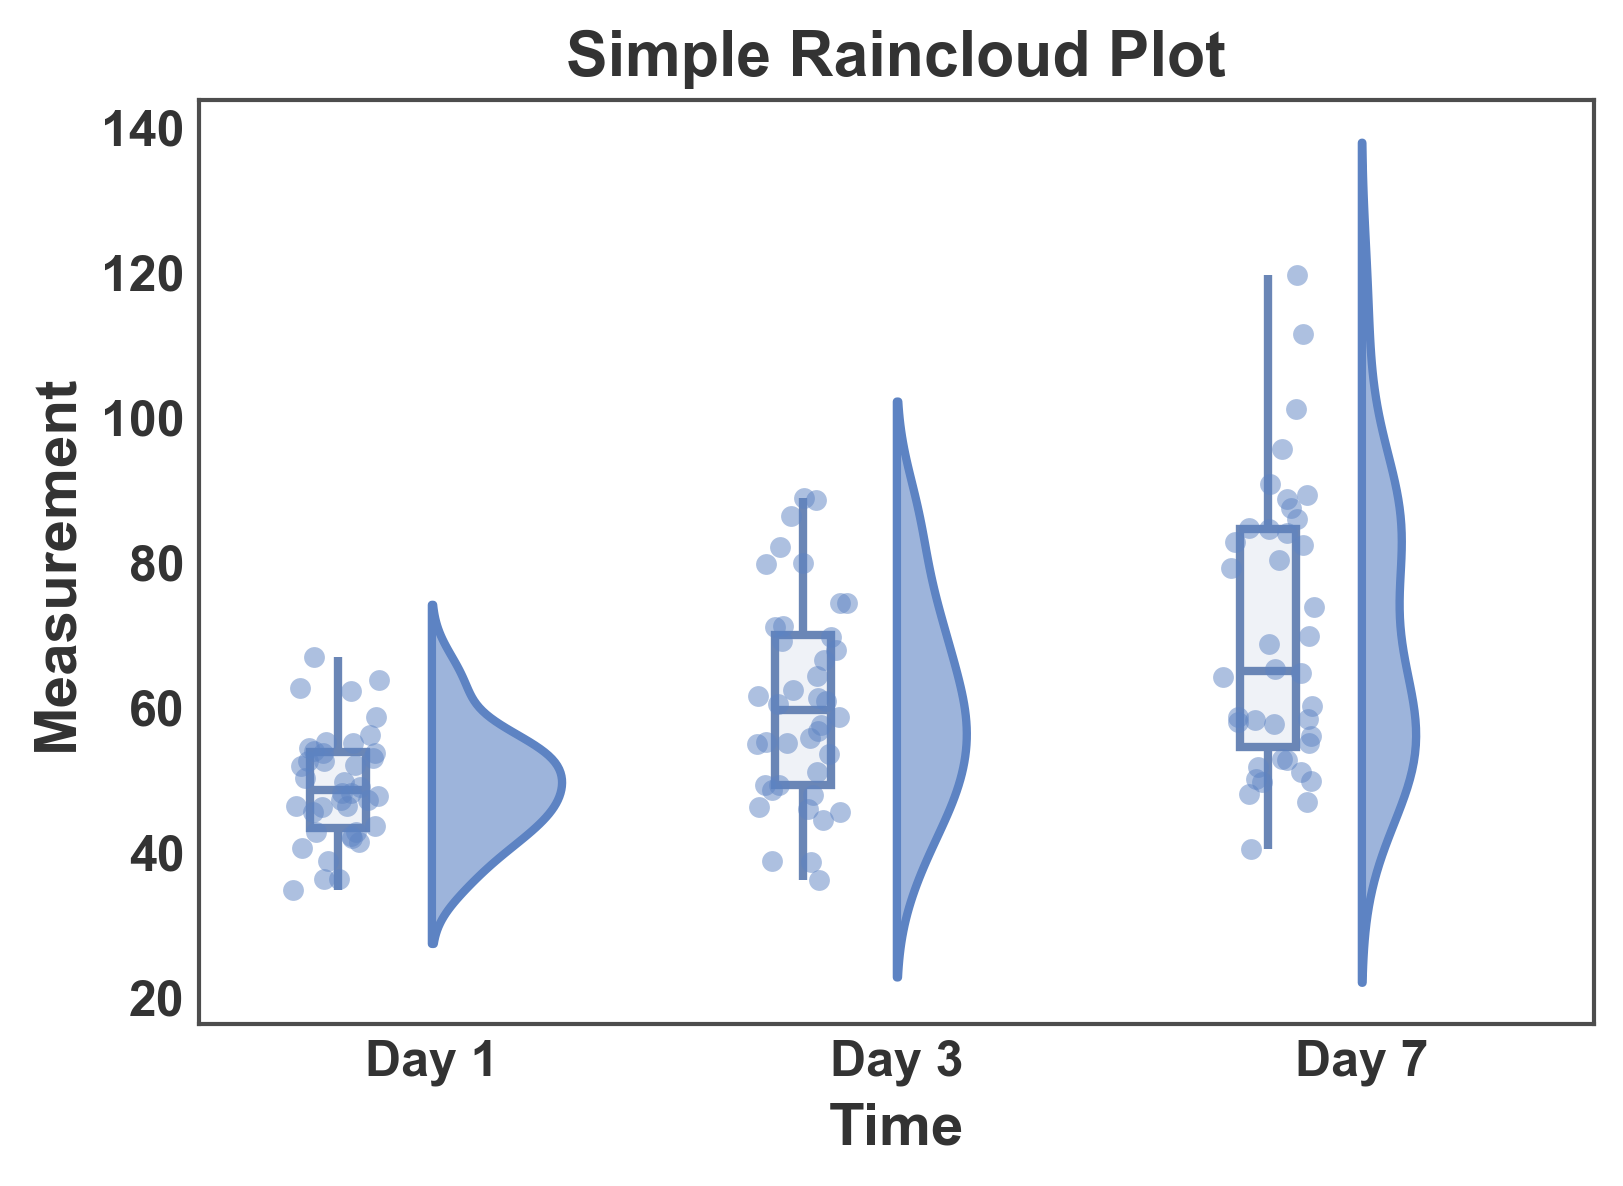
Simple Raincloud Plot
Basic raincloud plot showing distribution by category.
# Create sample data
np.random.seed(42)
raincloud_data = pd.DataFrame({
    'time': np.repeat(['Day 1', 'Day 3', 'Day 7'], 40),
    'group': np.tile(np.repeat(['Control', 'Treated'], 20), 3),
    'measurement': np.concatenate([
        np.random.normal(50, 8, 20), np.random.normal(52, 8, 20),
        np.random.normal(52, 9, 20), np.random.normal(70, 12, 20),
        np.random.normal(55, 10, 20), np.random.normal(85, 14, 20),
    ])
})


# Create simple raincloud plot
fig, ax = pp.raincloudplot(
    data=raincloud_data,
    x='time',
    y='measurement',
    title='Simple Raincloud Plot',
    xlabel='Time',
    ylabel='Measurement',
    cloud_alpha=0.6,
)
plt.show()
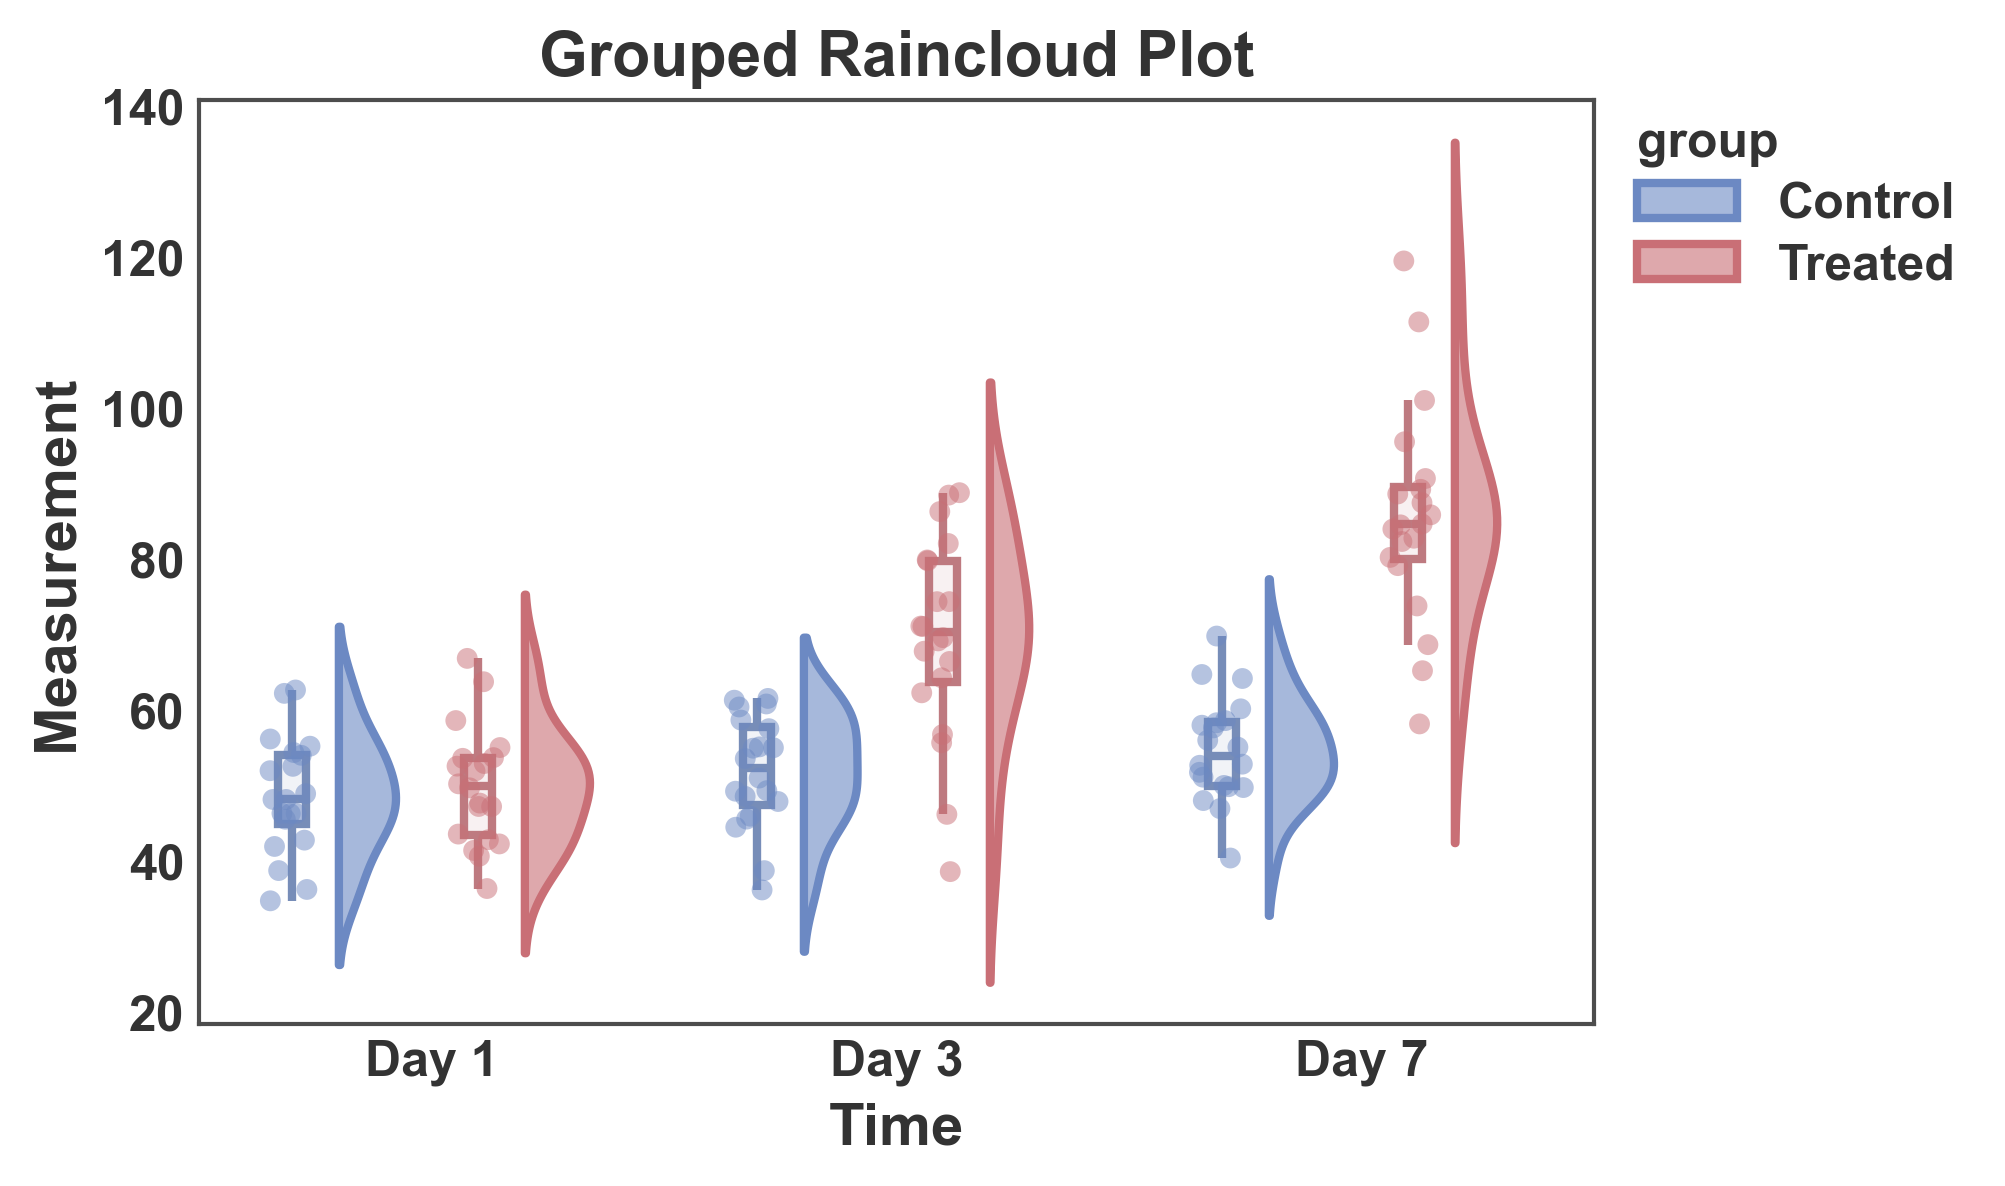
Raincloud Plot with Hue Grouping (Vertical)
Use the hue parameter to create grouped raincloud plots.
# Create grouped raincloud plot
fig, ax = pp.raincloudplot(
    data=raincloud_data,
    x='time',
    y='measurement',
    hue='group',
    title='Grouped Raincloud Plot',
    xlabel='Time',
    ylabel='Measurement',
    cloud_alpha=0.6,
    palette="RdGyBu_r",
    box_offset=0.1,
    rain_offset=0.1,
)
plt.show()
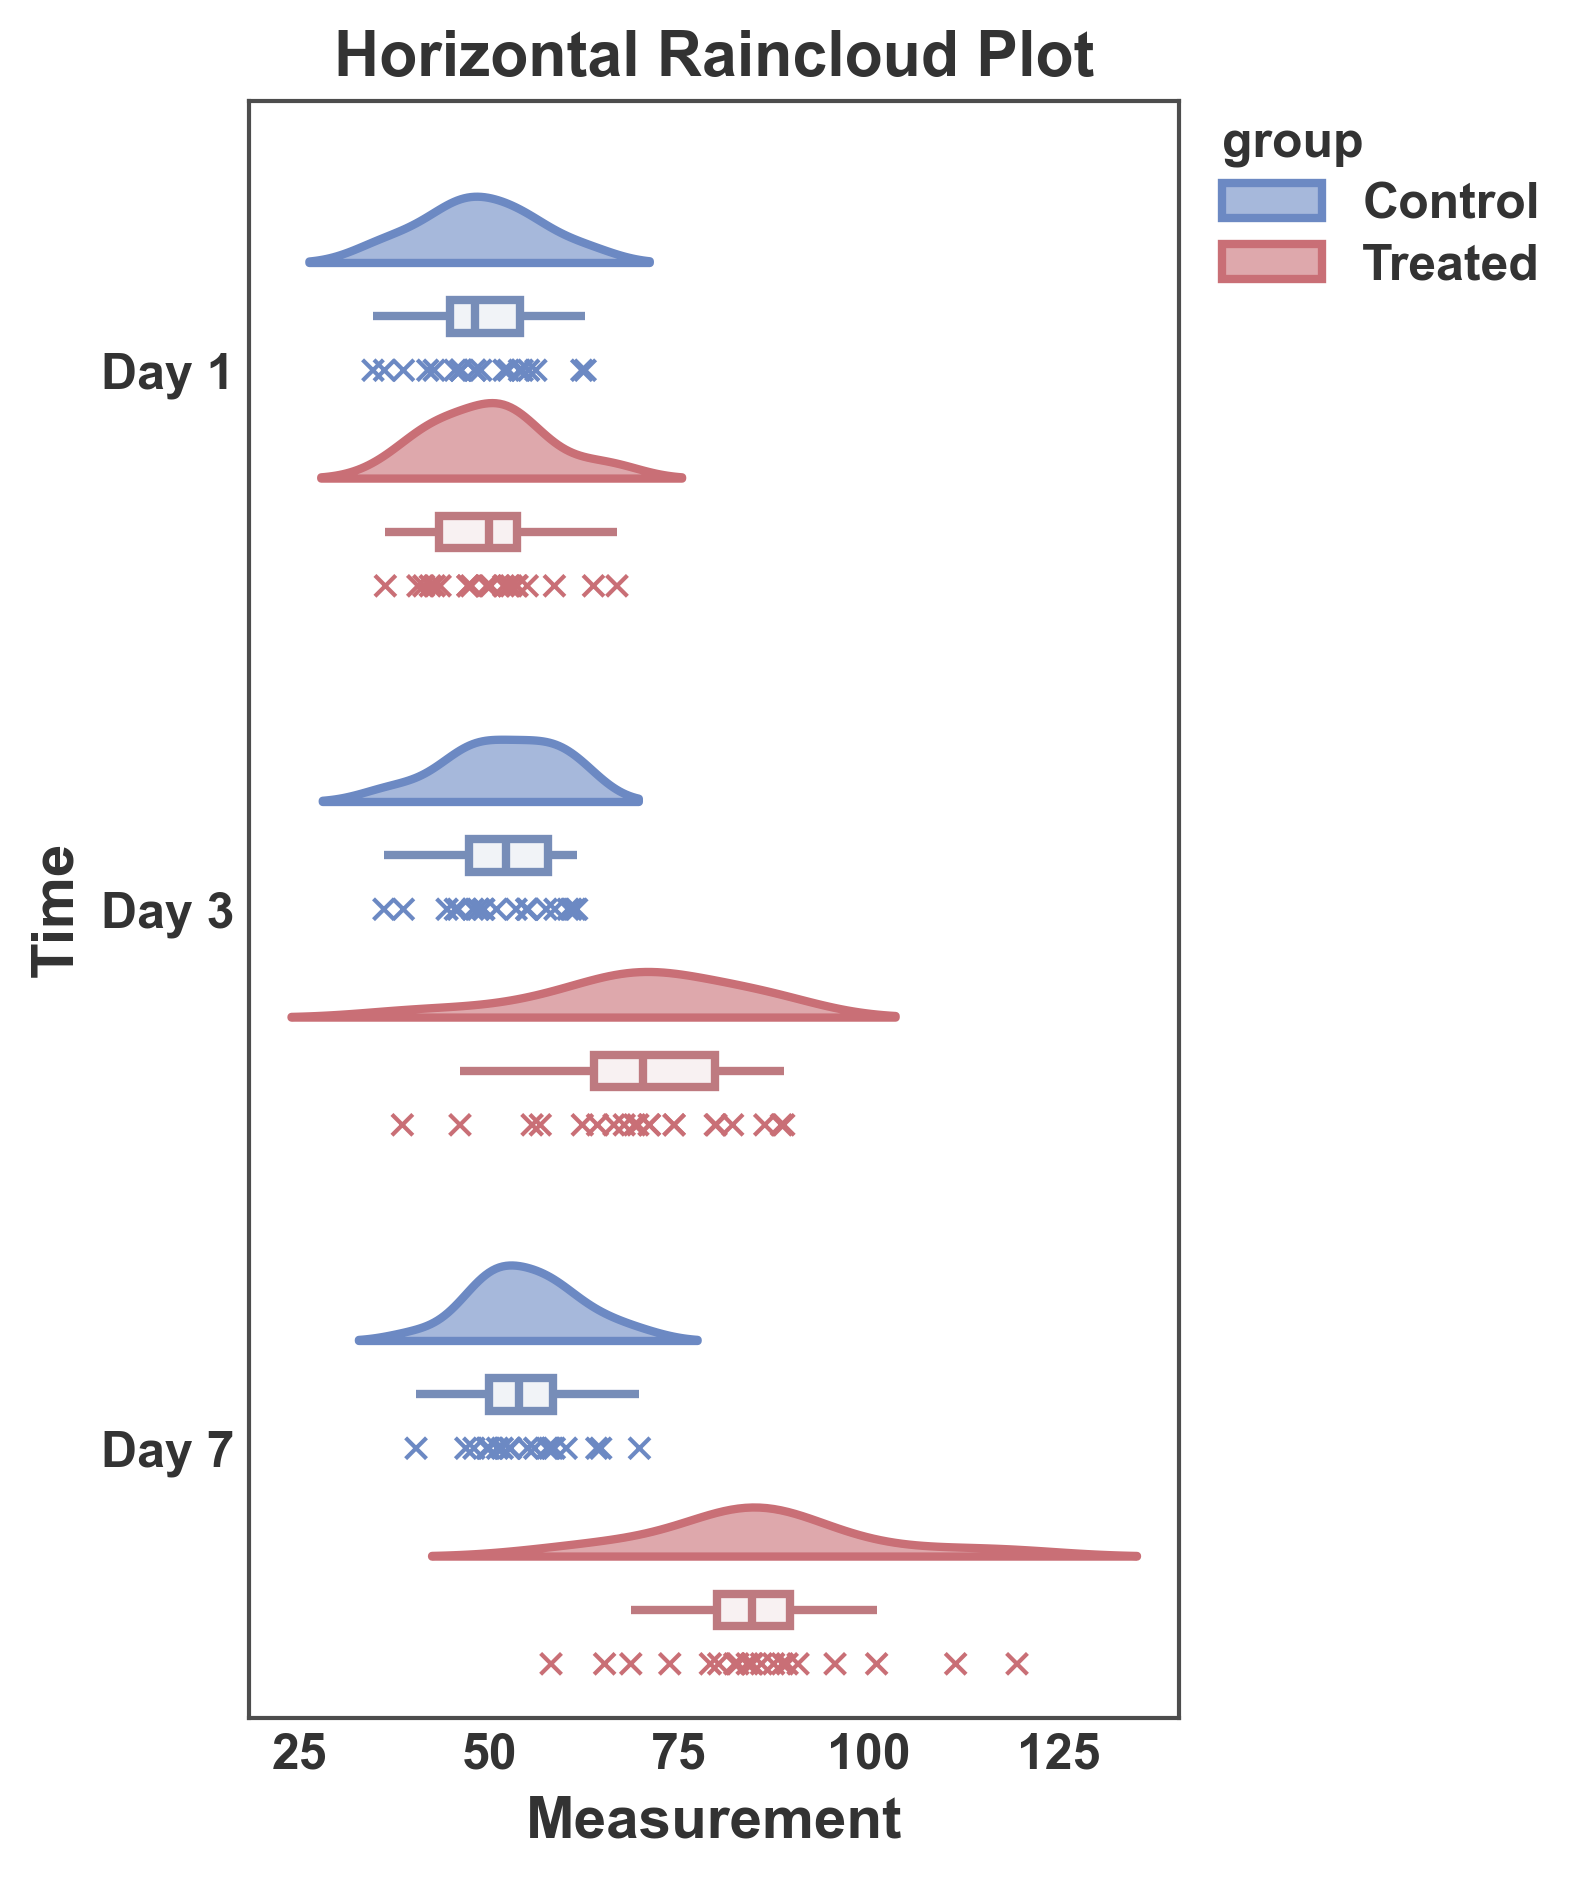
Horizontal Raincloud Plot with Hue
Create horizontal raincloud plots by swapping x and y.
fig, ax = pp.raincloudplot(
    data=raincloud_data,
    x='measurement',
    y='time',
    hue='group',
    cloud_side="left",
    title='Horizontal Raincloud Plot',
    xlabel='Measurement',
    ylabel='Time',
    cloud_alpha=0.6,
    palette="RdGyBu_r",
    figsize=(4, 7),
    box_offset=0.1,
    rain_offset=0.2,
    rain_kws=dict(
        linewidth=1,
        alpha=0.5,
        jitter=False,
        marker="x"
    )
)
plt.show()
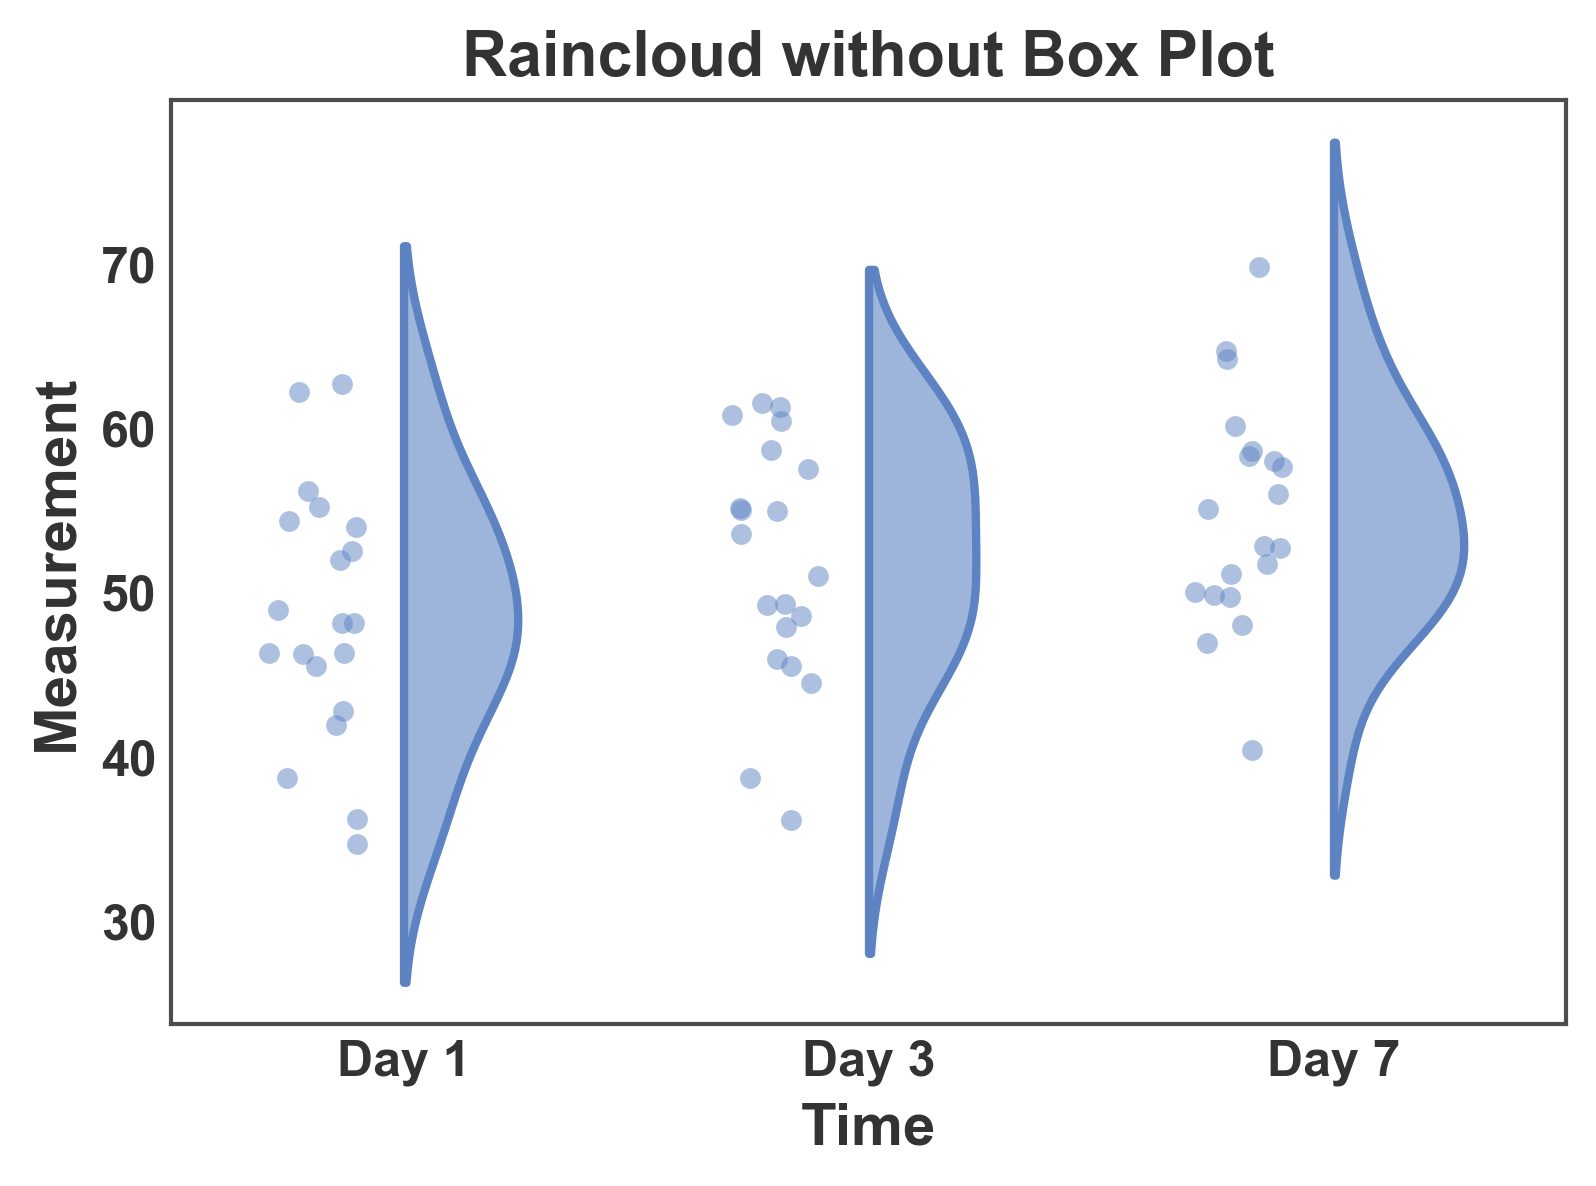
Customization
Raincloud Plot Without Box
Create raincloud plot with only cloud and rain elements.
fig, ax = pp.raincloudplot(
    data=raincloud_data[raincloud_data['group'] == 'Control'],
    x='time',
    y='measurement',
    box=False,
    title='Raincloud without Box Plot',
    xlabel='Time',
    ylabel='Measurement',
    cloud_alpha=0.6,
)
plt.show()
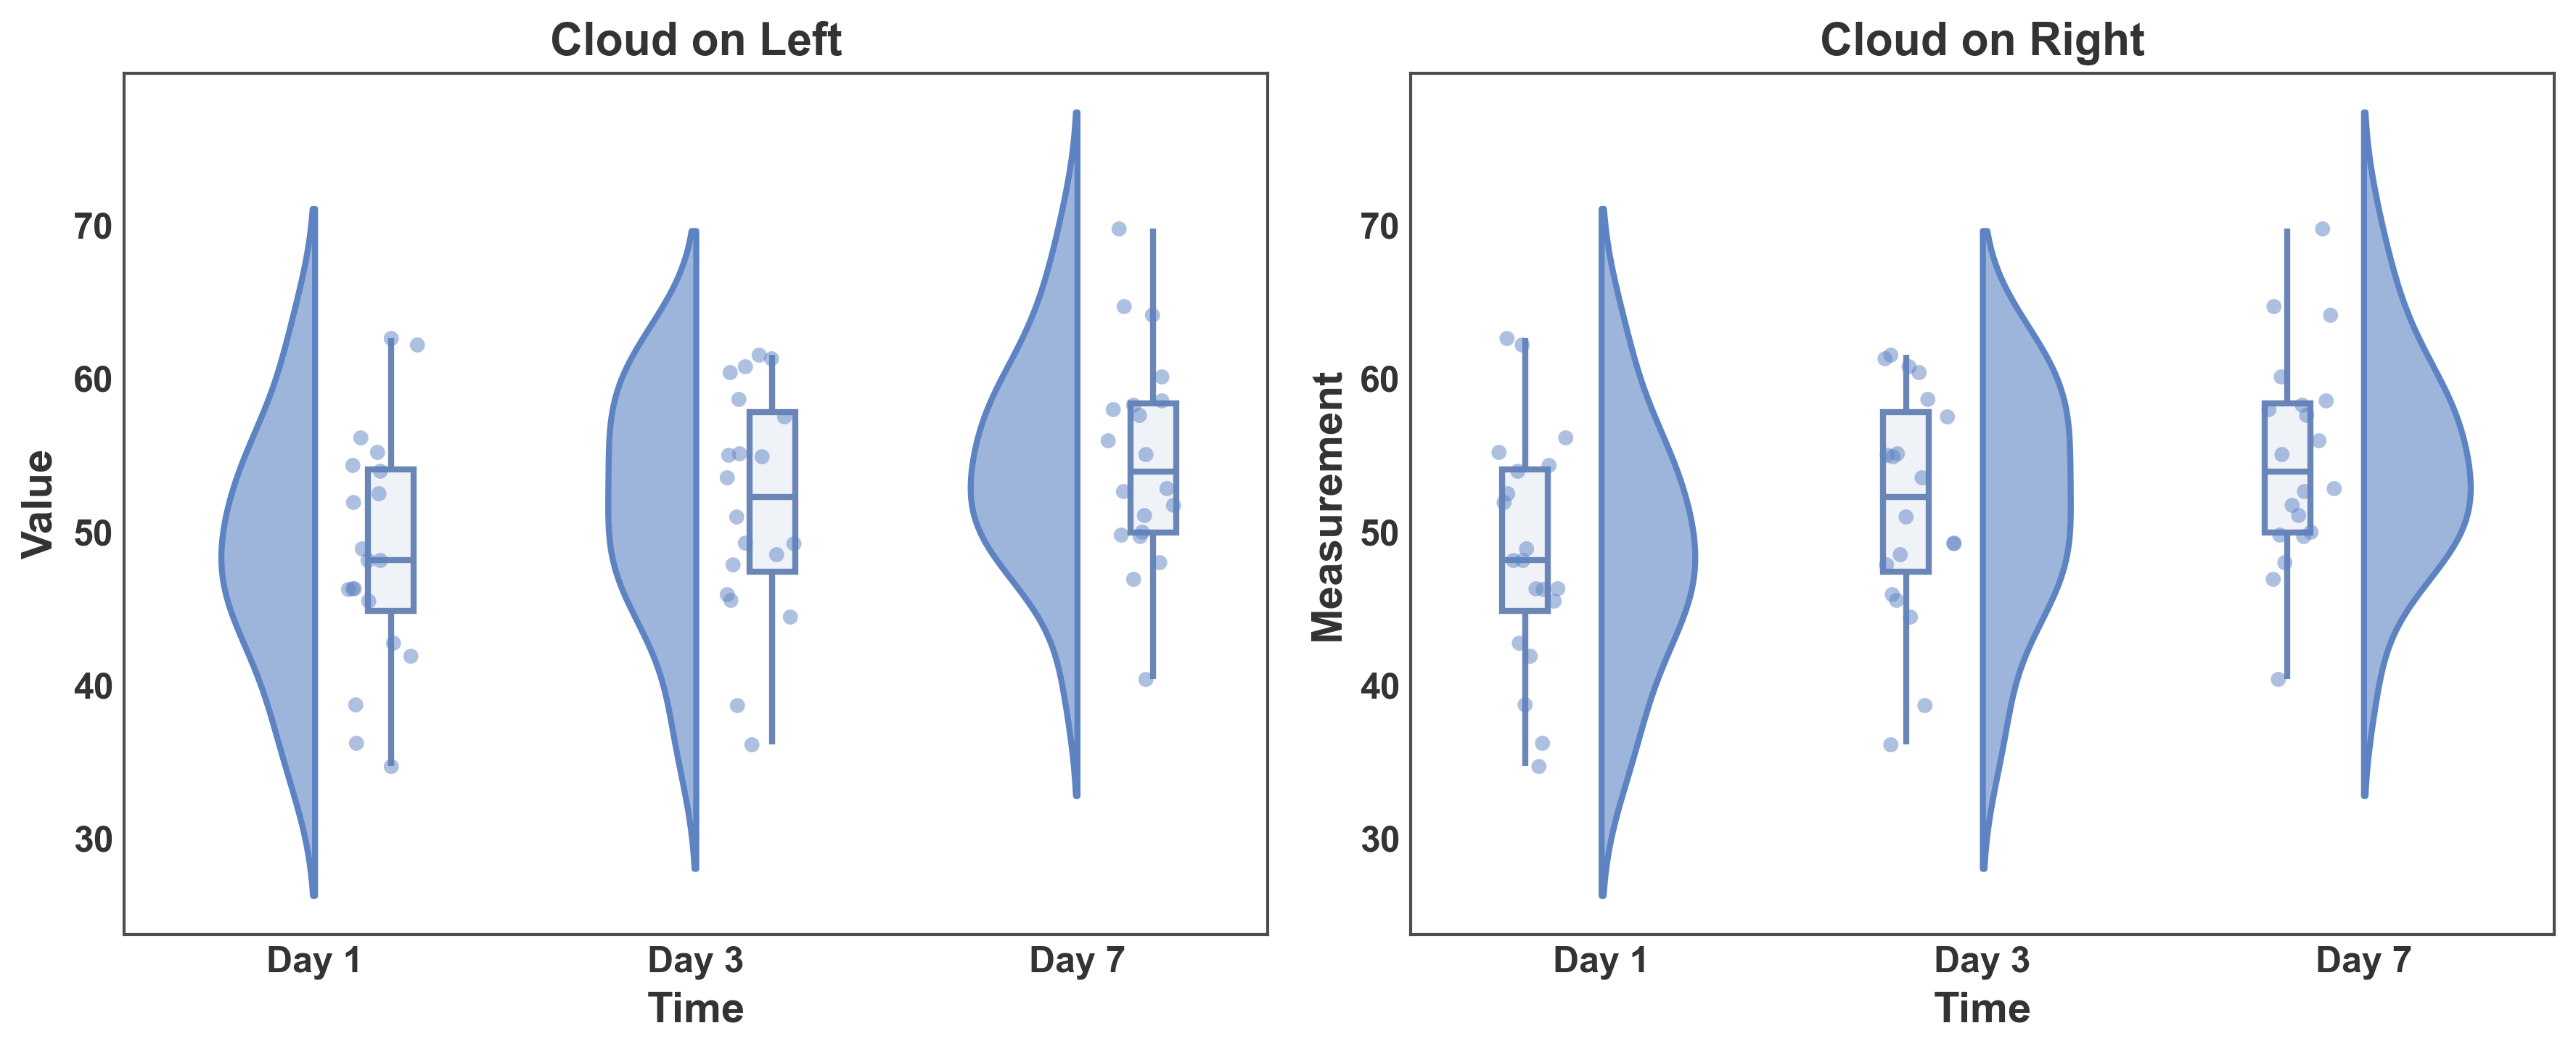
Raincloud Plot with Custom Cloud Side
Control which side the cloud appears on.
fig, axes = plt.subplots(1, 2, figsize=(12, 5))

# Cloud on the left
pp.raincloudplot(
    data=raincloud_data[raincloud_data['group'] == 'Control'],
    x='time',
    y='measurement',
    cloud_side='left',
    ax=axes[0],
    title='Cloud on Left',
    xlabel='Time',
    ylabel='Value',
    cloud_alpha=0.6,
)

# Cloud on the right (default)
pp.raincloudplot(
    data=raincloud_data[raincloud_data['group'] == 'Control'],
    x='time',
    y='measurement',
    cloud_side='right',
    ax=axes[1],
    title='Cloud on Right',
    xlabel='Time',
    ylabel='Measurement',
    cloud_alpha=0.6,
)

plt.tight_layout()
plt.show()
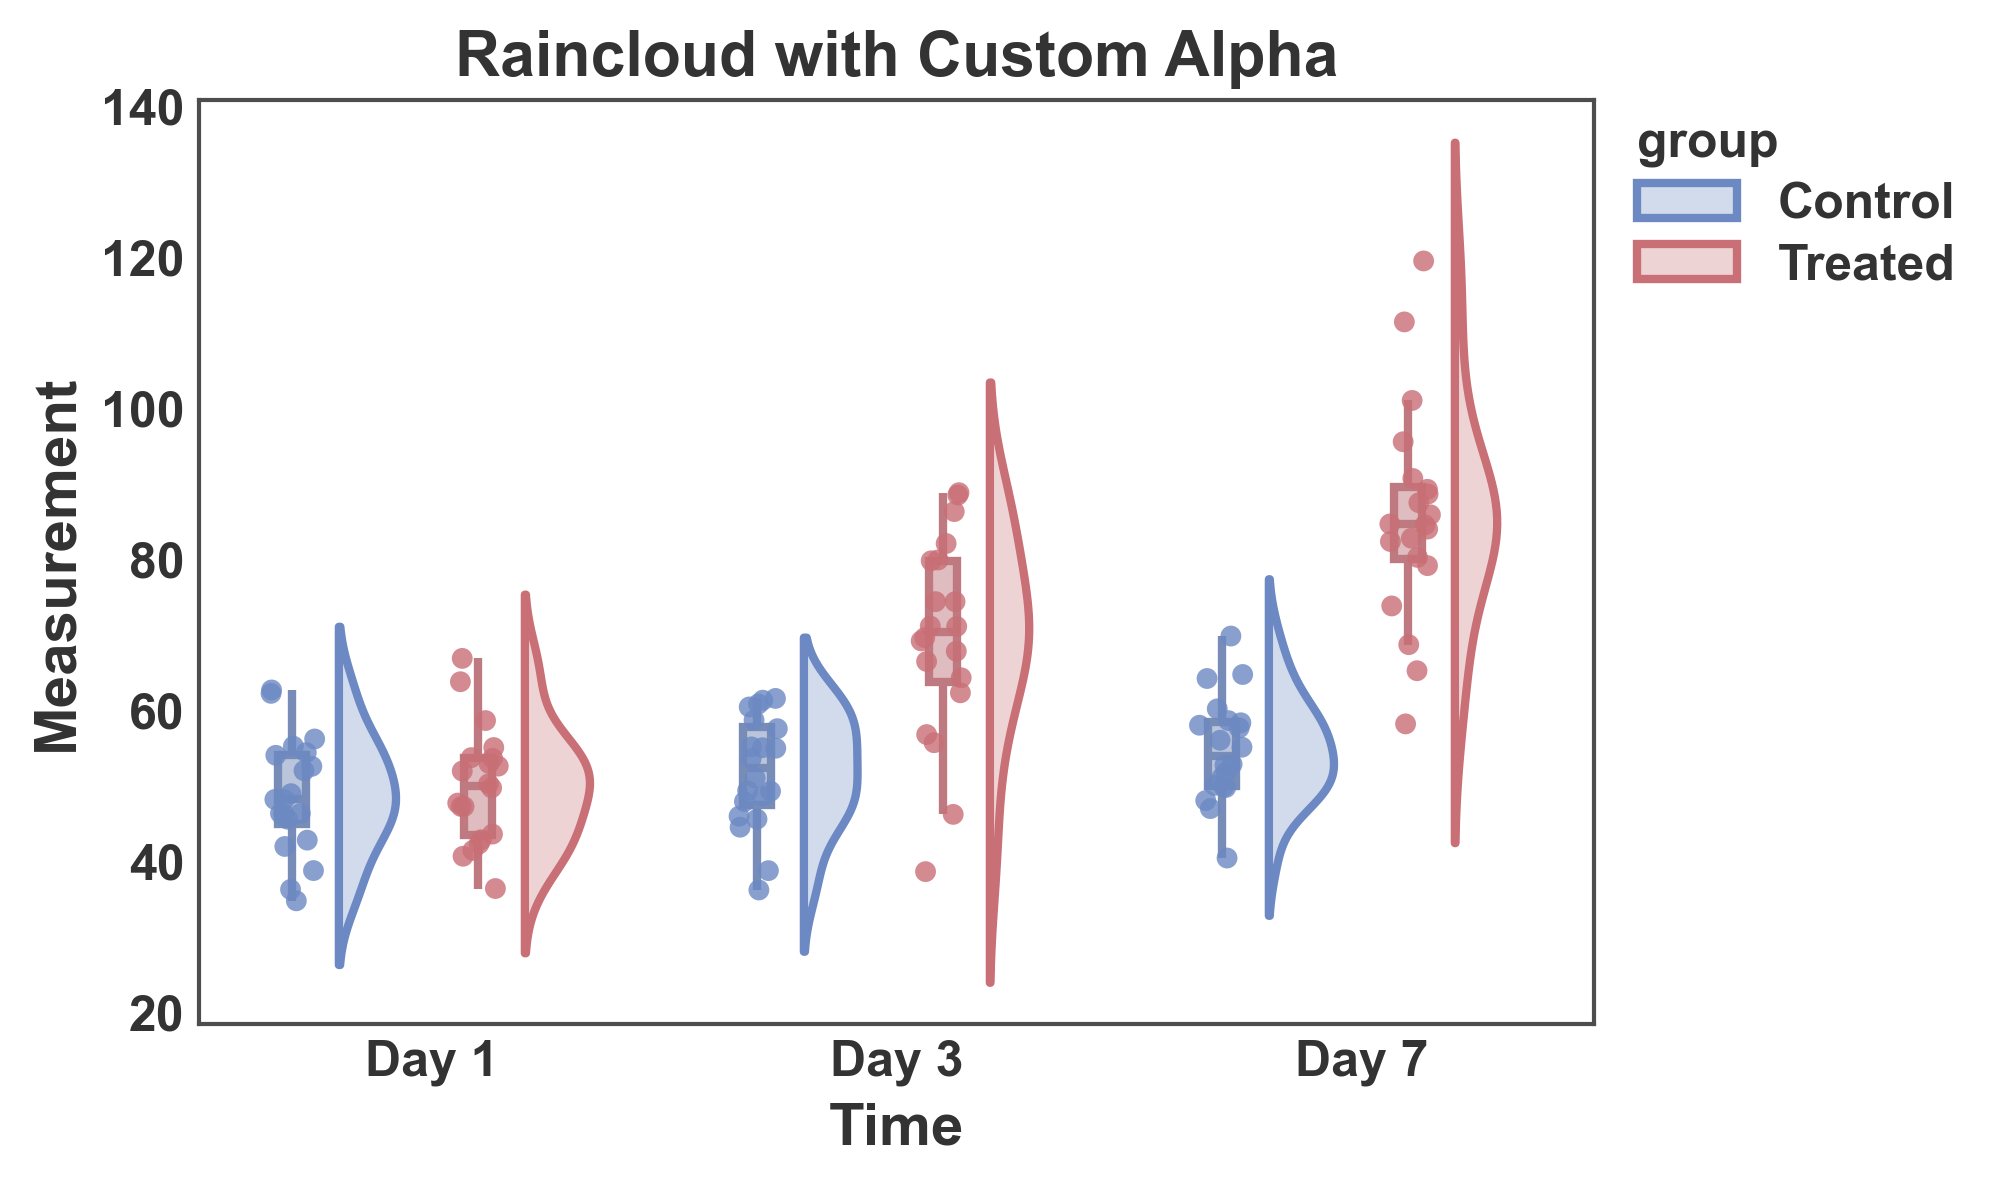
Raincloud Plot with Custom Alpha Values
Adjust transparency of different components.
fig, ax = pp.raincloudplot(
    data=raincloud_data,
    x='time',
    y='measurement',
    hue='group',
    title='Raincloud with Custom Alpha',
    xlabel='Time',
    ylabel='Measurement',
    cloud_alpha=0.3,
    box_kws=dict(alpha=0.5),
    rain_kws=dict(alpha=0.8, linewidth=0),
    palette="RdGyBu_r",
    box_offset=0.1,
    rain_offset=0.1,
)
plt.show()
Total running time of the script: (0 minutes 1.956 seconds)